With volatility returning to the public markets in the first quarter, private equity activity slowed somewhat but remained brisk in absolute terms. Fundraising declined from prior periods. Company investments and exits trended slightly lower, although venture capital funding rose.
Callan recommends vigilance in commitment pacing during this frothy market, in which the absolute pace of fundraising remains heated.
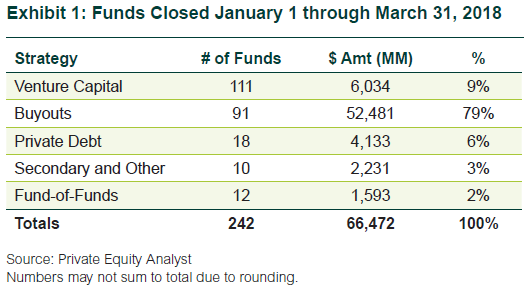
Private Equity Fundraising
First quarter private equity partnership commitments totaled $66.5 billion, with 242 new partnerships formed, according to Private Equity Analyst. The number of funds fell 22% from 310 in the first quarter of 2017, and the dollar volume declined 17% from $80.0 billion.
Buyouts
According to Buyouts newsletter, activity remained brisk as buyout funds closed 587 investments with $29.8 billion in disclosed deal value. While the number of investments is larger than in any single quarter in 2017, the announced dollar volume is lower than in any of last year’s quarters.
Buyout prices remained high with buyout purchase price multiples averaging close to 11.0x EBITDA. Average leverage levels continued to be upwards of 6.0x EBITDA. Various data sources corroborate that add-on acquisitions comprised well over half of recent quarters’ total deal count. The average equity contribution across all buyouts remains significant, in the 43% of total purchase price range.
Buyout M&A exits trended up to 164 from 159 in the previous quarter, but announced dollar volume plunged 48% to $28.8 billion from $55.2 billion, according to Buyouts. However, the fourth quarter of 2017 saw an unusually large announced dollar value.
There were 11 buyout-backed IPOs in the first quarter raising an aggregate $3.9 billion, up from only four totaling $860 million in the last quarter of 2017.
Venture Capital
New investments in venture capital (VC) companies set a record with $28.2 billion of announced value, according to the National Venture Capital Association (NVCA), jumping 33% from the prior quarter. The NVCA cited 17 unicorn financings totaling $7.2 billion as aiding the large total (unicorns are VC companies with valuations of over $1 billion). The number of rounds of financing totaled 1,693, down 18% from 2,076 the prior quarter. The median pre-money valuation continues to increase; only Series D+ fell, down 20%.
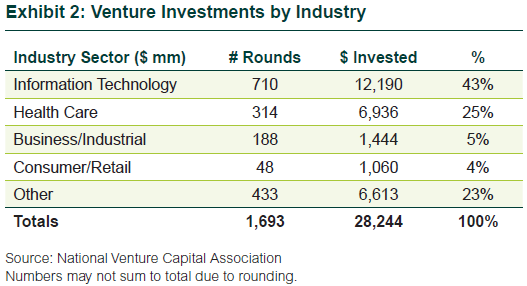
Information Technology companies received 43% of the first quarter’s funding (Exhibit 2), up slightly from the sector’s 40% for the full year 2017. Health Care’s 25% share held steady with the prior year. Business/Industrial declined 3 percentage points compared to 2017. Consumer/Retail and Other remained the same.
Later-stage investments received 59% of the first quarter’s new funding in 420 rounds totaling $16.7 billion. The value was larger than any prior quarter tracked by PitchBook, going back over a decade. Early-stage companies received $9.9 billion across 546 rounds, setting a similar decade-long record. The startup/seed category was down slightly from the three prior quarters, but bested last year’s first quarter start.
Venture-backed M&A exits totaled 188 transactions and disclosed value hit $8.1 billion. Both figures declined from the fourth quarter, which had 200 sales with announced values totaling $12.6 billion.
There were 15 VC-backed IPOs in the first quarter with a combined float of $2.1 billion. For comparison, the fourth quarter of 2017 had 22 IPOs and total issuance of $3.1 billion.
Private Equity Returns
Both public and private equity have had positive quarterly returns since the third quarter of 2015. The full year 2017 was extremely strong, even with a steep drop-off in public equity the last two weeks of December. Private equity returned almost 20% for the year, but still lagged the public markets by more than 2 percentage points. The public equity market’s strong run-up pushed it to outpace private equity for the 3-month, 1-year, and 5-year time horizons.
The Thomson Reuters/Cambridge database’s fourth-quarter 2017 All Private Equity return was 4.82%, up slightly from 4.73% in the third quarter. For comparison, the S&P 500 Index rose 6.64% and the Russell 3000 Index (which includes small cap) gained 6.34%. By strategy type, all returns were positive. Growth Equity had the highest return (+5.83%), followed by Buyouts (+5.38%).