


You are currently viewing this website using the Internet Explorer (IE) web browser. This website has limited functionality in IE, and you won’t be able to download research documents. For an optimal experience, please access this website using any other supported web browser.
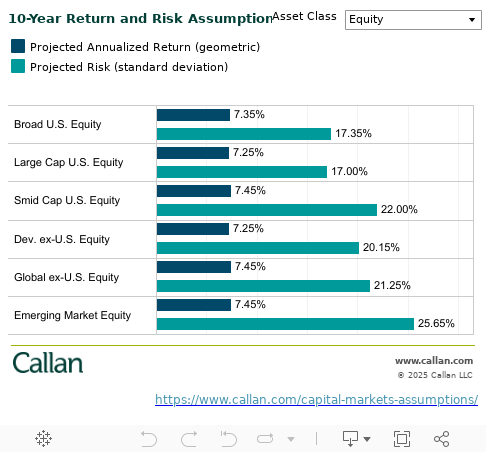
The 2026-2035 Capital Markets Assumptions are Callan’s
long-term expectations for return and volatility for
broad asset classes.
Explore our long-term outlook for return and risk for all of the major asset classes. In this chart, you can view those assumptions by asset class type, such as equities or fixed income. Simply hover over the various bars in the chart to see the relevant index.
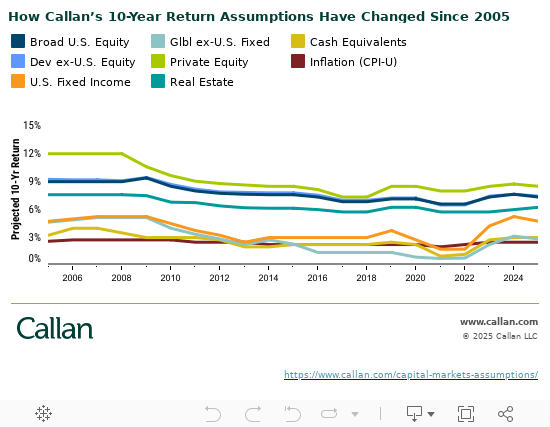
How have our Capital Markets Assumptions done compared to actual returns? Read our blog post here.
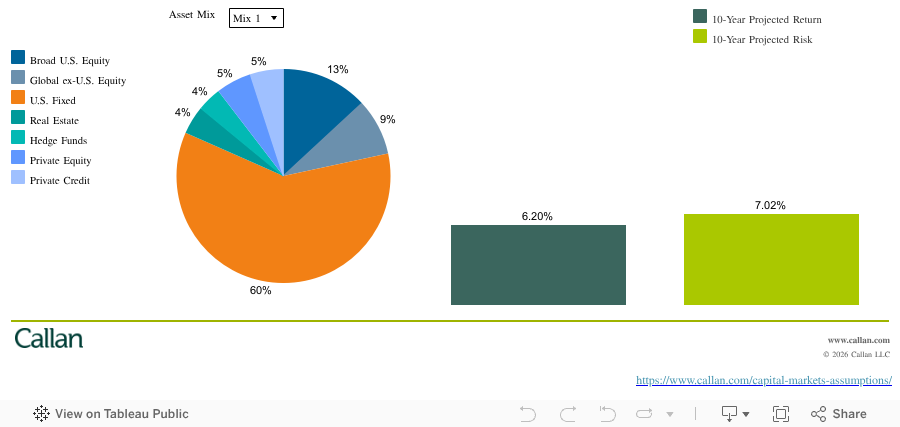
Our famous “Risky Business” pie charts use the CMAs to illustrate what it has taken over time to earn the same return. Find the latest results here.
Jay Kloepfer
Executive Vice President
and Director of Capital Markets Research group
For Investment Managers & Advisers
You are now leaving Callan LLC’s website and going to Callan Family Office’s website. Callan Family Office is not affiliated with Callan LLC. Callan LLC has licensed the Callan® trademark to Callan Family Office for use in providing investment advisory services to ultra-high net worth clients, family foundations, and endowments. Callan Family Office and Callan LLC are independent, unaffiliated investment advisory firms separately registered with the Securities and Exchange Commission under the Investment Advisers Act of 1940.
Callan LLC is not responsible for the services and content on Callan Family Office’s website. Inclusion of this link does not constitute or imply an endorsement, sponsorship, or recommendation by Callan LLC of their website, or its contents, and Callan LLC is not responsible or liable for your use of it. When visiting their website, you are subject to Callan Family Office’s terms of use and privacy policies.