You are currently viewing this website using the Internet Explorer (IE) web browser. This website has limited functionality in IE, and you won’t be able to download research documents. For an optimal experience, please access this website using any other supported web browser.
Underlying fund performance, asset allocation, and cash flows of more than 130 large defined contribution plans representing approximately $500 billion in assets are tracked in the Callan DC Index.
Markets Pull Back After Strong Run
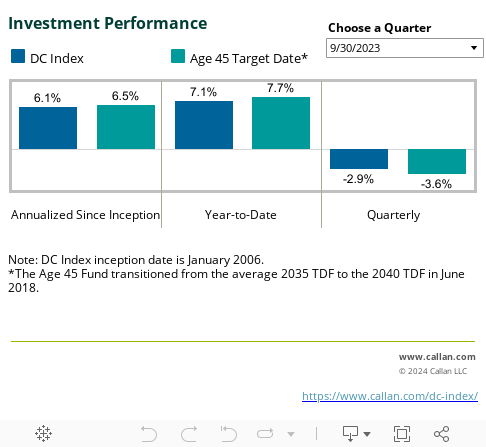
The Callan DC Index™ declined 1.9% during 1Q26 following three consecutive quarters of gains, bringing the trailing one-year return to 15.4%. The Callan Target Date 2045 Peer Group outperformed the Index during both the quarter (-1.4%) and the trailing one-year period (+18.3%). Over longer time horizons, the Peer Group’s higher equity allocation has contributed to stronger annualized since-inception returns of 8.1% compared to 7.2% for the Index.
*The tracking of the Callan DC Index started in January 2006.
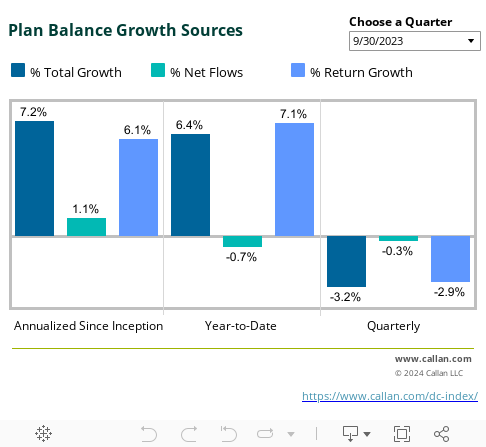
Positive Contributions Partially Offset Market Losses
Average participant balances declined 1.2% during the quarter after increasing 1.0% in the prior period. Investment performance was the primary driver of the decline, detracting 1.9%, while positive net flows of 0.7% offset market losses. Net flows remain an important indicator of participant savings behavior and the ability of plans to retain assets as participants approach and enter retirement.
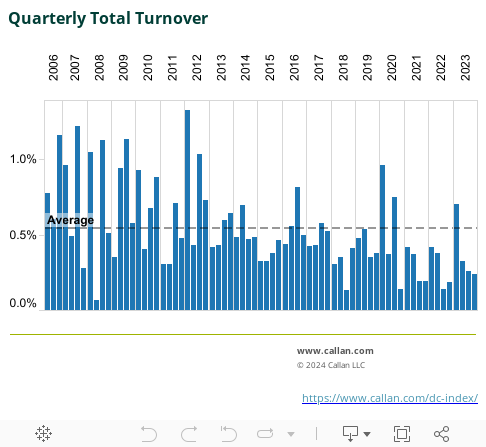
Net Transfer Activity Remains Negligible
Turnover (i.e., net transfer activity within DC plans) was just 0.01% in 4Q25, its lowest level since Index inception and well below the historical average of 0.51%.
This muted activity indicates minimal participant-driven reallocation across asset classes during the quarter, reinforcing that changes in asset allocation were largely driven by market performance rather than investor behavior.
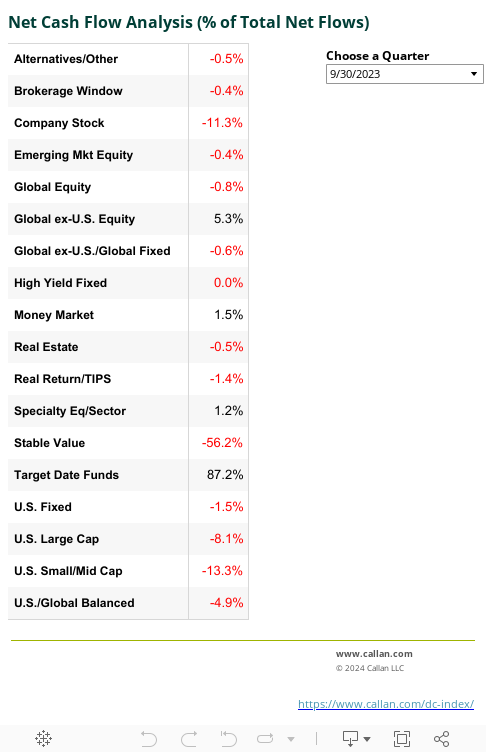
Target date funds continued to attract the majority of inflows during the quarter, receiving 77.3% of total inflows. Global ex-U.S. equity (9.8%) and U.S. fixed income (7.7%) also experienced positive flows. Meanwhile, U.S. small/mid cap equity (-26.0%), U.S. large cap equity (-19.7%), stable value (-19.3%), company stock (-17.8%), and balanced funds (-9.9%) experienced notable outflows. Index composition was largely stable during the quarter, with net transfer activity of 0.32%, supporting the comparability of flow trends to prior periods.
Multi-quarter patterns such as the continued rotation away from standalone equity toward target date funds may reflect a combination of organic participant behavior, auto-enrollment defaults in newer plans entering the Index, and the asset class mix of any plans added or removed during the period. Net flows remain a meaningful indicator of broad savings and allocation trends across the DC landscape but are best interpreted alongside plan-level data where precision is required.
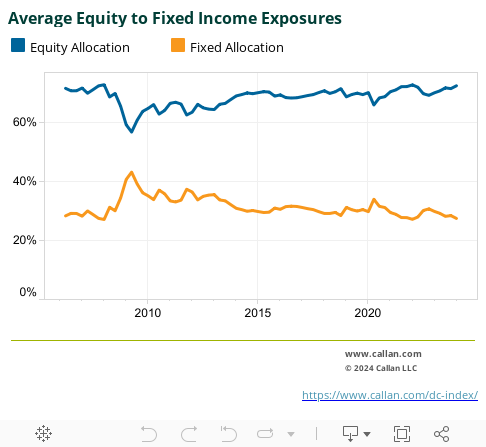
Equity Exposure Remains Above Historical Levels
The Index’s overall equity allocation declined modestly from 75.3% to 74.8% during the quarter. Despite the decrease, equity exposure remains well above the Index’s historical average of 69.1%, indicating that participant portfolios continue to maintain a relatively growth-oriented positioning.
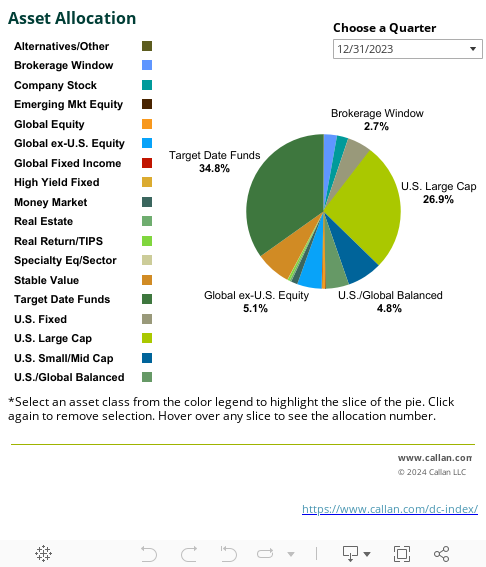
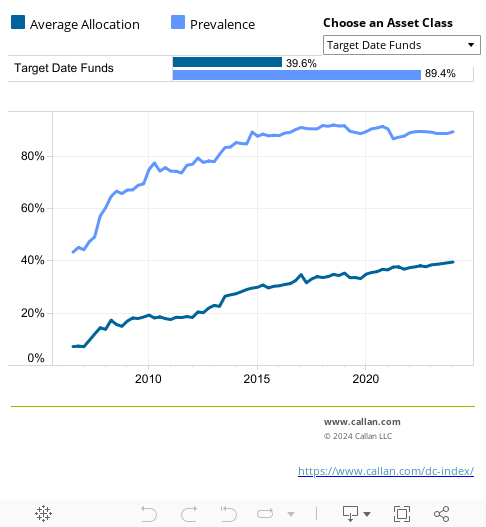
Target Date Funds Continue to Gain Share of Plan Assets
Target date funds continued to increase their share of total plan assets and now represent 41% of assets within the Index. U.S. large cap equity remains the largest standalone equity allocation at 28% of assets. Changes in asset allocation during the quarter generally aligned with observed flow trends, as target date funds gained share while several traditional asset classes experienced modest declines.
Target Date Funds and Stable Value Remain Core Menu Offerings
Target date funds remain the most widely offered multi-asset solution, available in 90% of plans within the Index. Stable value funds increased in prevalence to 71%, while U.S. large cap equity, global ex-U.S. equity, and U.S. fixed income continue to be nearly universal offerings. Emerging market equity experienced one of the largest declines in prevalence during the quarter, falling to 15% of plans, reflecting the continued simplification of some investment lineups.
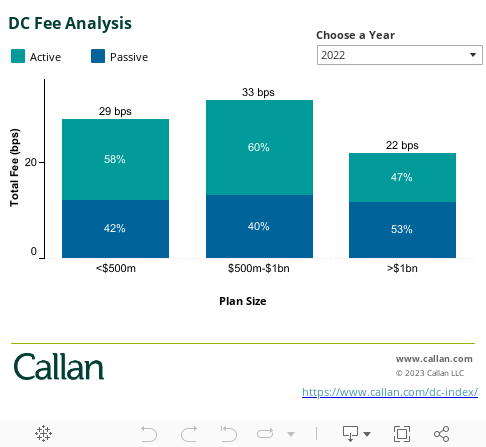
The DC Fee Analysis chart shows the average total investment management fee by plan size, as well as the average share of plan assets allocated to active and passive options. Fees for each fund (including mutual funds, collective trusts, and separate accounts) within a plan are asset-weighted to determine the average total fee. This exhibit will be updated annually with the release of third quarter DC Index results, and this updated data should be available shortly.
Using 3Q23 data, for plans with assets less than $500 million in assets, the average asset-weighted fee decreased by 3 basis points from 3Q22. Plans with assets between $500 million and $1 billion saw the largest fee decrease of 9 bps, while the fee for plans with more than $1 billion in assets had a decrease of 4 bps. Fee decreases were largely driven by a combination of increased use of passive mandates as well as lower breakpoints and new lower fee vehicles and share classes for actively managed options.
For Investment Managers & Advisers
You are now leaving Callan LLC’s website and going to Callan Family Office’s website. Callan Family Office is not affiliated with Callan LLC. Callan LLC has licensed the Callan® trademark to Callan Family Office for use in providing investment advisory services to ultra-high net worth clients, family foundations, and endowments. Callan Family Office and Callan LLC are independent, unaffiliated investment advisory firms separately registered with the Securities and Exchange Commission under the Investment Advisers Act of 1940.
Callan LLC is not responsible for the services and content on Callan Family Office’s website. Inclusion of this link does not constitute or imply an endorsement, sponsorship, or recommendation by Callan LLC of their website, or its contents, and Callan LLC is not responsible or liable for your use of it. When visiting their website, you are subject to Callan Family Office’s terms of use and privacy policies.