
Private equity rebounded in 2Q26, returning 5.3% after a roughly flat first quarter. Venture capital again led, supported by artificial intelligence investment and SpaceX’s initial public offering. Growth equity and buyouts also gained, although private equity trailed the rally in public stocks. Activity updates through 3Q showed capital continuing to concentrate in larger funds and transactions, while distributions to investors remained below historical norms.
Details on Private Equity Activity
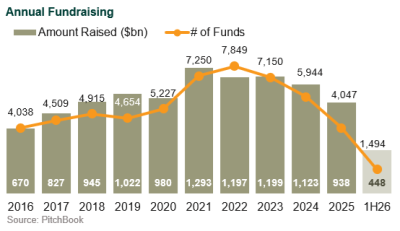
Fundraising | Capital raised held up in 2026, but commitments flowed to fewer, larger funds. Buyout fundraising remained on track for a third consecutive annual decline. Venture capital fundraising, however, surpassed its 2025 total, supported by several large fundraises.
With exits uneven, limited partners favored managers that demonstrated realized distributions. This emphasis on returning capital accompanied continued concentration in fundraising, even as venture capital and buyout fundraising followed different paths.
Deal Activity | First-half deal value paced ahead of 2025, driven by venture capital, while deal count paced below it. Capital concentrated in fewer, larger transactions.
Buyout investment during 1H26 remained on pace with 2025, but activity slowed in 2Q. Software repricing, inflation, wider credit spreads, and interest rate uncertainty made large transactions harder to underwrite. U.S. software deal value partially recovered in 3Q, concentrated in businesses viewed as insulated from AI disruption. Add-on acquisitions accounted for 75% of U.S. buyouts year to date. Entry multiples remained elevated as higher-quality assets continued to sell.
Venture capital and growth equity investment dollars in 1H26 reached approximately 85% of the full-year 2025 total. Large AI financings for OpenAI, Anthropic, and xAI drove activity, while median valuations increased at every stage, led by late-stage companies.
By 3Q, U.S. venture-growth deal value had fallen to $30 billion from $197 billion in 1Q as frontier-lab financings tapered. Nevertheless, AI represented 82.7% of year-to-date deal value, and transactions of at least $100 million accounted for 75% of third quarter value. U.S. first-time financings reached 8,625 through 3Q, exceeding 2021’s full-year record as AI tools lowered startup costs.
Exits | Buyout exit value paced slightly below 2025. U.S. private equity exit values did rebound in 3Q, with sales to strategic buyers representing approximately 60% of value. Activity remained concentrated in larger transactions, while smaller assets proved difficult to sell.
Venture capital exit value reached a first-half record, almost entirely attributable to SpaceX’s approximately $1.7 trillion IPO. The IPO market had not broadly reopened: Of 18 venture-backed IPOs in 3Q, 12 involved health care companies. SpaceX’s $60 billion cash acquisition of Cursor accounted for most third-quarter venture exit activity.
LP Distributions | Distributions over the trailing 12 months through 2Q26 totaled 12% of beginning net asset value, compared with the historical norm of approximately 20%. Distributions exceeded contributions in 2025 for the first time since 2021, and that pattern continued into 2026.
Dry Powder | Undeployed capital declined modestly from its 2023 peak, reflecting slower fundraising. Fundraising typically adds to dry powder, while investment activity reduces it.
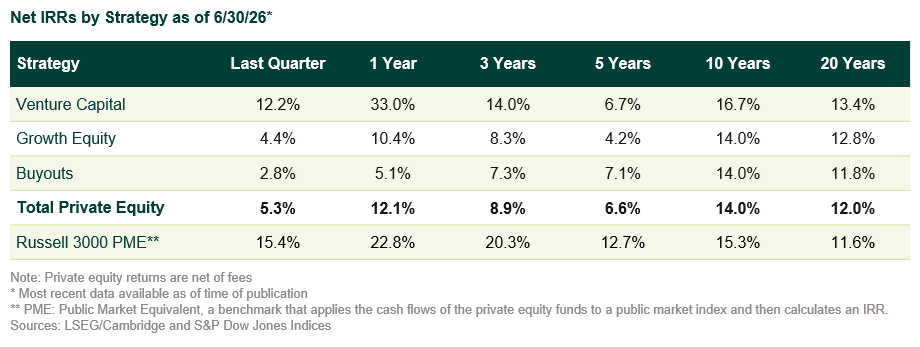
Performance | According to LSEG/Cambridge, venture capital returned 12.2% in 2Q26 and 33.0% over one year. Growth equity gained 4.4% for the quarter, while buyouts rose 2.8%. The Russell 3000 public market equivalent jumped 15.4%.
Venture capital led over 1, 3, and 10 years, while buyouts held a narrow five-year advantage as the 2022–23 drawdown continued to weigh on venture results. Private equity’s annualized returns were 14.0% over 10 years and 12.0% over 20 years. The asset class outperformed its public market equivalent over 20 years but trailed over 10 years.
Disclosures
The Callan Institute (the “Institute”) is, and will be, the sole owner and copyright holder of all material prepared or developed by the Institute. No party has the right to reproduce, revise, resell, disseminate externally, disseminate to any affiliate firms, or post on internal websites any part of any material prepared or developed by the Institute, without the Institute’s permission. Institute clients only have the right to utilize such material internally in their business.