By Mark Andersen and Jay Kloepfer
The S&P 500 entered correction territory last week, plunging more than 10 percent in five trading days after volatility exploded on Feb. 2. Investors betting on continuing low volatility saw big losses, and markets around the globe shuddered in response. As last week lurched along, with sharp reversals on Tuesday and Friday, investors are asking, will the shaking stop soon? When will we get back to normal?
THIS is normal. We must remind ourselves that substantial volatility and drawdown risk in the equity market is normal, and that 2017 was likely as abnormal a year as we’ve seen in some time: the U.S. stock market rose steadily with little volatility all year. The S&P 500 typically sees a realized volatility as measured by standard deviation of around 15; last year’s volatility, as measured by the 12-month standard deviation of the index, was just 5.5 in December.
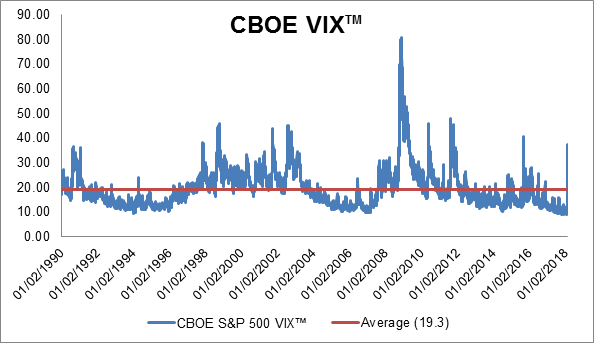
The VIX, an index that measures investors’ forward-looking volatility expectations, has averaged 20 over time. Last year saw 53 days when the VIX closed below 10, and it set an intra-day record low of 8.56 on Nov. 27. Prior to 2017, there were 9 days TOTAL in the 24 years since the launch of live data in early 1993 in which the VIX closed below 10. We saw only eight days where the S&P moved 1% or more during 2017, compared to 1995 with 13, 1972 with 10, and 1964 with just 3. The fourth quarter of 2017 saw NO 1% changes in the S&P 500. In fact, 2017 was also the first year on record where the S&P saw NO down months, recording 15 consecutive positive months through December. The S&P closed at record highs 66 times during the year, a feat unseen since the 1990s.
The market drop on Feb. 5 was indeed the largest point drop in history for several market indices (the S&P Price Only Index was down 113.19), and last Thursday recorded the third largest point drop. However, putting the moves in context, the decline last Monday (-4.1%) was the 42nd largest percentage drop in history. A lion’s share of the larger drops occurred during the Global Financial Crisis (20), along with 4 in each of the Taper Tantrum in 2015, the fourth quarter of 1987, and, the bursting of the Dot-Com Bubble and tech wreck aftermath in 2000-2002. Regardless of the direction of the move, the 113.19 drop was still the largest point change on record, although it ranked only 78th as the largest percentage move in either direction.
The point to the recitation of all this data: the return to volatility last week is actually a return to normal. The persistent low volatility in 2017 and in particular the no-volatility fourth quarter were the anomalies. The ostensible reason for the market sell-off last week was a report on rising compensation that appeared to confirm concerns about a nascent acceleration in inflation, or at least inflationary pressures. These concerns were related to a recent interest rate hike, reports on continuing strong economic growth, and rising stock market valuations that were increasingly touted as rich.
However, little of this is actually “news,” in the sense of being new information (not fake news!). The Fed has been telegraphing potential rate hikes, loudly, for the past few years, and if anything has been under-delivering, dragging its feet on raising rates. The growth in the economy has been steady and without much surprise, and quite modest by historical standards. The recent wage report showing the annual growth rising from 2% to 3% is neither shocking nor unexpected and is simply the cumulative effect of steady growth tightening the labor markets, a slow-moving development that has been open for all to see. Higher multiples for stocks were arguably justified by low interest rates, and the well-telegraphed rise in rates was bound to have an impact and should come as no surprise, either.
Last year was a wonderful interlude for investors yet by no means should that Goldilocks scenario be extrapolated to the future. As last week reminded market participants, volatility can and will return. For long-term investors, changes made as the result of volatility should follow the discipline applied to changes made at all times: carefully considered, and best done in relative calm and not during the heights of the maelstrom.
For more perspective on the capital markets and the economy in 2017, please see Jay’s blog post here.
66
The number of record high closes for the S&P 500 in 2017, a feat unseen since the 1990s.