Highlights from the Global Markets in 4Q23
U.S. Equity: The S&P 500 Index approached a record high as the year closed. Of note, 2023 was the first year since 2012 that the S&P failed to reach a high-water mark. That said, the index was up an impressive 11.7% in 4Q and 26.3% for the year. The tech sector was the clear winner for the quarter and the year (+17.2%; +57.8%) while Energy (-6.9%; -1.3%) was the only sector to register both a 4Q and 2023 decline.
Small caps (R2000: +14.0%; R1000: +12.0%) outperformed large caps for the quarter but lagged for the year (R2000: +16.9%; R1000: +26.5%). Growth outperformed value in 4Q (R1000 Growth: +14.2%; R1000 Value: +9.5%) and even more substantially for the year (R1000 Growth: +42.7%; R1000 Value: +11.5%).
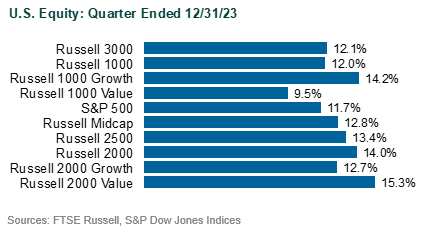
Index concentration continued to have a notable impact on returns in 4Q. The “Magnificent Seven,” which comprise over 25% of the S&P 500, accounted for 76% of the 2023 return for the index. Fourth quarter and 2023 returns for the bunch were impressive: Alphabet: +6.8%, +58.8%; Amazon: +19.5%, +80.9%; Apple: +12.6%, +49.0%; Meta: +17.9%; +194.1%; Microsoft: +19.3%, +58.2%; NVIDIA: +13.9%, +239.0%; Tesla: -0.7%, +101.7%. The index would have been up only about 10% for the year without these stocks, and the equal-weighted S&P 500 returned 11.9% in 4Q and 13.9% in 2023.
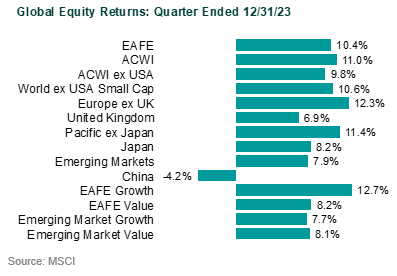
Global Equity: Global ex-U.S. equities (MSCI ACWI ex USA: +9.8%) performed well in 4Q and for the year (+15.6%) but lagged the U.S. Weakness in the U.S. dollar helped 4Q returns across developed markets (MSCI EAFE: +10.4%; MSCI EAFE Local: +5.0%). As in the U.S., growth outperformed value in the quarter (MSCI ACWI ex USA Growth: +11.1%; MSCI ACWI ex USA Value: +8.4%). However, value outperformed growth for the full year (MSCI ACWI ex USA Growth: +14.0%; MSCI ACWI ex USA Value: +17.3%).
Mirroring the U.S., Technology was the strongest sector for both the quarter and the year (MSCI ACWI ex USA Information Technology: +20.0%; +36.3%).
Emerging markets (MSCI Emerging Markets: +7.9%) also did well but underperformed developed ex-U.S. Emerging Asia was the weakest region (+6.7%; +7.8%) for both periods, hurt by China. China was a notable laggard (-4.2%; -11.2%). Latin America (+17.6%; +32.7%) was the best-performing region for the quarter and the year with Mexico (+18.6%; +40.9%) and Brazil (+17.8%; +32.7%) up strongly.
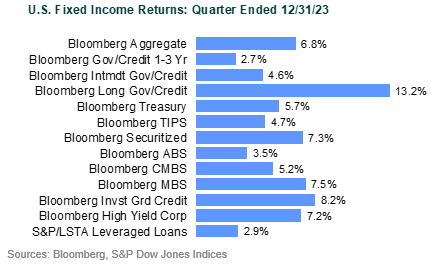
U.S. Fixed Income: The 10-year U.S. Treasury yield was volatile in 2023—ranging from an April low of 3.31% post the regional banking “crisis” to the October high of 4.99% and subsequently declining into year-end for a 3.88% close. Falling rates drove returns for the Bloomberg US Aggregate to +6.8% in 4Q and +5.5% in 2023, a sharp contrast to the -1.2% YTD print as of 9/30. Corporate credit strongly outperformed U.S. Treasuries in 4Q (excess returns of 203 bps) and for the year (455 bps). High yield (Bloomberg US High Yield) climbed 7.2% for the quarter and was up an equity-like 13.4% for the year.
The yield curve remained inverted, but to a much lesser extent; 35 bps between the 2-year and 10-year U.S. Treasury yields versus more than 100 bps earlier in the year. The Bloomberg Municipal Bond Index soared 7.9% in 4Q, reversing its YTD 1.4% decline as of 9/30; the index was up 6.4% for the year.
Global Fixed Income: The Bloomberg Global Aggregate ex USD Index rose 9.2% (hedged: +5.4%) in 4Q as rates fell and the U.S. dollar weakened. Full-year results (+8.3% hedged; +5.7% unhedged) were also positive but reflected an overall stronger greenback. Emerging market debt indices also posted solid returns. The hard currency JPM EMBI Global Diversified gained 9.2% in 4Q and 11.1% in 2023. The local currency-denominated JPM GBI-EM Global Diversified returned 8.1% in 4Q and 12.7% for the year.
Real Assets: Real assets generally performed well in 4Q with the notable exception being energy. Reflecting sharp declines in natural gas and oil, the S&P GSCI sank 10.7% for the quarter. Metals were up, with gold hitting a new high (S&P Gold Spot Price: +11.0%). Materials (S&P 100 Materials: +13.1%), REITs ((MSCI: US REIT: +16%), and infrastructure (DJB Global Infrastructure: +12.1%) all posted double-digit returns. TIPS underperformed nominal U.S. Treasuries but were up 4.7% for the quarter (Bloomberg US TIPS Index).
Disclosures
The Callan Institute (the “Institute”) is, and will be, the sole owner and copyright holder of all material prepared or developed by the Institute. No party has the right to reproduce, revise, resell, disseminate externally, disseminate to any affiliate firms, or post on internal websites any part of any material prepared or developed by the Institute, without the Institute’s permission. Institute clients only have the right to utilize such material internally in their business.