Highlights from the Global Markets in 1Q24
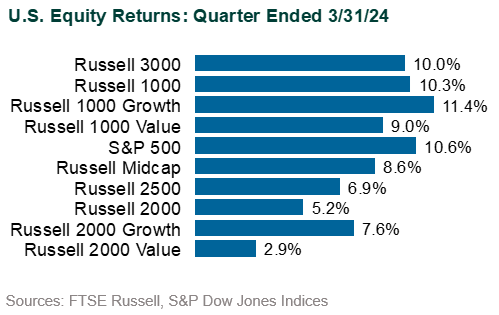
U.S. Equity: U.S. stocks rallied sharply in 1Q24 with the S&P 500 Index (+10.6%) closing the quarter at a record high for the 22nd time during the quarter. Communication Services (+15.8%), Energy (+13.7%), and Technology (+12.7%) were the top-performing sectors with Real Estate (-1.1%) being at the bottom and the only sector to deliver a negative return. The equal-weighted version of the Index gained a more modest 7.9% as the largest stocks continued to outperform. The top 10 holdings hit another high at 33.5% of the Index on a cap-weighted basis. Growth (Russell 1000 Growth: +11.4%) outperformed Value (Russell 1000 Value: +9.0%) and large cap (Russell 1000: +10.3%) outperformed small (Russell 2000: +5.2%). Of the “Magnificent Seven,” only Apple (-10.8%) and Tesla (-29.2%) suffered losses. The seven were up 13% for the quarter, with the S&P 500 Index ex Mag 7 up 6%.
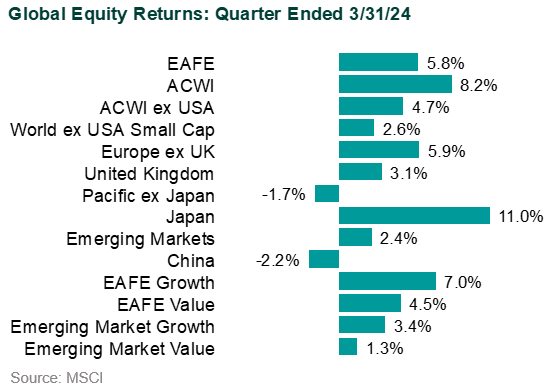
Global Equity: The U.S dollar strengthened against most currencies, most notably the Japanese yen (-7%). The MSCI ACWI ex USA Index trailed the U.S. with a 4.7% gain (Local: +8.2%). Technology (+10.7%) was the best-performing sector. Most countries delivered gains but from a regional perspective, Pacific ex-Japan (-1.7%) was hurt by weak performance from Hong Kong (-11.7%). In contrast, Japan (+11.0%) saw double-digit gains that were even better in local terms (+19.2%). Emerging Markets (MSCI EM: +2.4%) were up modestly, trailing developed markets. Latin America (-4.0%) was dragged down by poor results from Brazil (-7.4%) and Chile (-4.5%). China (-2.2%) also weighed on emerging market performance.
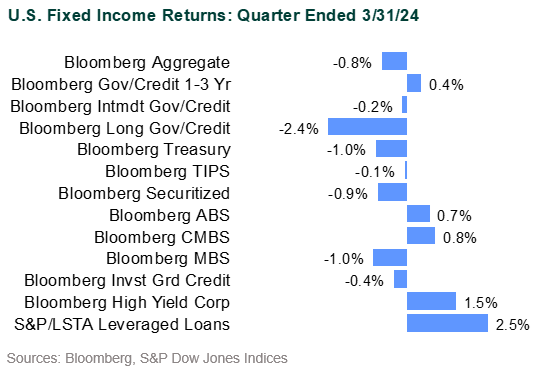
U.S. Fixed Income: Bond yields rose modestly in 1Q as expectations dwindled for aggressive rate cuts amid stubbornly high inflation. The U.S. Treasury 10-year yield rose from 3.88% as of year-end 2023 to 4.20% at the end of 1Q24. The Bloomberg US Aggregate Bond Index fell 0.8% for the quarter. Ten-year breakeven spreads, a measure of the market’s expectation for inflation over the next decade, rose from 2.16% to 2.32%. U.S. TIPS outperformed nominal U.S. Treasuries (Bloomberg US TIPS: -0.1%; Bloomberg US Treasury: -1.0%). Investment grade corporate bonds outperformed U.S. Treasuries by 89 bps on a duration-adjusted basis, fueled by strong demand that easily absorbed record supply for a first quarter and the second largest quarterly issuance ever. High yield corporates (Bloomberg HY: +1.5%) outperformed the investment grade market despite an uptick in the default rate to 5.7%, according to data from Barclays Research. Leveraged loans performed even better (S&P/LSTA Leveraged Loans: +2.5%).
Municipal Fixed Income: Municipal bonds outperformed taxable bonds for the quarter. The Bloomberg Municipal Bond Index fell 0.4% with lower quality sharply outperforming higher quality (AAA: -0.8%; BAA: +0.6%). The Bloomberg Managed Money Short/Intermediate Index fell 0.9%. Robust demand easily absorbed supply and most municipal/Treasury ratios remained well below historical averages.
Global Fixed Income: Rates rose in most developed markets and U.S. dollar strength eroded returns for unhedged investors (Bloomberg Global Aggregate ex US: -3.2%; Hedged: +0.6%). Emerging market debt performed relatively well, especially high yield. The JP Morgan EMBI Global Diversified Index rose 2.0% with the high yield component up 4.9%. Conversely, the local debt GBI-EM Global Diversified Index sank 2.1%. Currency depreciation vs. the U.S. dollar hurt returns; the local currency return for the Index was +0.7%. Most currencies were down versus the dollar for the quarter.
Disclosures
The Callan Institute (the “Institute”) is, and will be, the sole owner and copyright holder of all material prepared or developed by the Institute. No party has the right to reproduce, revise, resell, disseminate externally, disseminate to any affiliate firms, or post on internal websites any part of any material prepared or developed by the Institute, without the Institute’s permission. Institute clients only have the right to utilize such material internally in their business.