The U.S. stock market reached a new high today, with the Dow cresting 23,163 while the S&P 500 hit 2,562. Thirty years ago today, on October 19, 1987, the U.S. stock market shook the global financial system to its core, dropping more than 20% in ONE DAY. So today’s peak coincides with the 30th anniversary of Black Monday, an event of now-mythic proportions.
Only a small percentage of current market participants were around to remember that day, but the impact reverberated for years, even decades. While the 2000-2002 Dot-com Bubble bursting and the Global Financial Crisis suffered greater peak-to-trough losses, none contained a single-day drop that came anywhere near a 20% decline. (For the record, I was a researcher at a unit of Standard & Poor’s in 1987, and had taken that Monday off to show San Francisco to some visitors. We went to Alcatraz, and upon returning to shore around 5:00 pm, were greeted with 3-inch bold headlines reading “Dow Drops 500!” I was uncertain as to whether I still had a job.)
Various commentators this week have pointed out just how great the capital market returns have been since Black Monday, but we thought it would be interesting to look at the last 30 years and INCLUDE the impact of Black Monday. As the nerds who have to sift through the capital market data on a regular basis, we are constantly looking to torture the numbers to come up with interesting confessions.
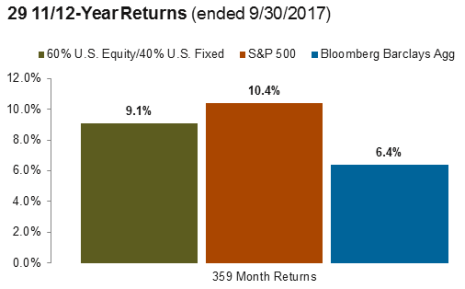
First, how strong have the capital markets been since October 1987? The S&P 500 has compounded at 10.4% per year on a monthly basis, starting November 1, 1987, through September 30, 2017. (We use monthly data here to simplify the discussion.) The Bloomberg Barclays Aggregate compounded at 6.5% over this period. (The Aggregate was not the standard bond benchmark until the mid-1990s, but the analysis using other indices yields very similar results.) A simple mix of 60% S&P 500 and 40% Aggregate generated a return of 9.1%. What about the effect of diversification into other asset classes? Research published today by Deutsche Bank shows that the S&P 500 was the winner over this period, topping bond and equity markets around the globe, and at the low end of the range (3% return and lower), commodities, gold, currencies, and oil. So diversification across this period would likely have detracted from returns.

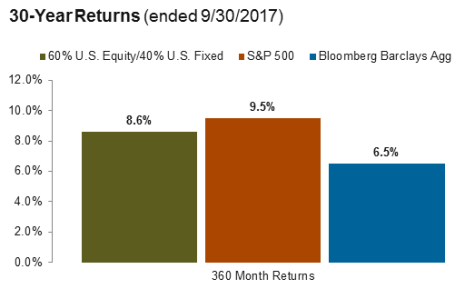
Now, what if we added that extra month to the calculation, October 1987? The compound return on the S&P 500 falls to 9.5%, almost one whole percentage point lower, compounded over 30 years! The bond returns are essentially unchanged, so the compound results for the simple 60/40 drops from 9.1% to 8.6%. Astounding (to me) how much impact one day had on 30-year returns.

However, what stands out even more to me is that 8.6% return, even after accounting for Black Monday. If you’d just stuck with 60/40 over the last 30 years, through all those capital market calamities and bubbles in the intervening years, you’d still have gotten 8.6% annualized. It was certainly an interesting ride, but if you’d fastened your seatbelt and hung on, and didn’t attempt to get off along the way—most likely at the wrong time—you’d have achieved the promise of the long-term investor.
More interesting, 100% invested in investment grade bonds would have given you 6.5%, all the way through today. We as an industry sure went through a lot of time and effort in pursuit of that last 2% return. But in hindsight, isn’t that always the case? We spend an inordinate amount of time chasing the last increment to return.

