Listen to This Blog Post
The U.S. and global economies showed signs of slowing toward the end of 2024, through leading indicators such as sentiment, consumer confidence, planned discretionary spending (think of travel, vacations, leisure), and business spending plans and capital investment. The stock and bond markets are also leading indicators of investor sentiment. Broad economic indicators such as employment, income, production, and housing, in contrast to the leading indicators, held up through 2024 and into 1Q25, but these data are collected after the fact. The typical pattern of macroeconomic data is that if a recession is expected, the stock and bond markets will react while the economy is still doing well (according to these after-the-fact data points). The same process works in reverse; the stock market looks forward to better times after repricing and can often look rosy while the economy struggles to hit bottom and recover. The lag in reporting of the broad economic data can frustrate us as the economy hits a turning point; we sense the situation has changed but we have to wait for confirmation.
1Q25 Economy: What to Know and What Comes Next
Why does this data lag matter? March 31 now seems like a long time ago. We must remind ourselves that the upheaval in global capital markets did not strike until April, after 1Q25 ended. The data through March confirm expectations for a softening in the economy in the first quarter, but these data do not include the impact of the tariff announcements in April. The 1Q data do include declines in business and consumer confidence that began to accumulate in advance of the April announcements and actions by the administration.

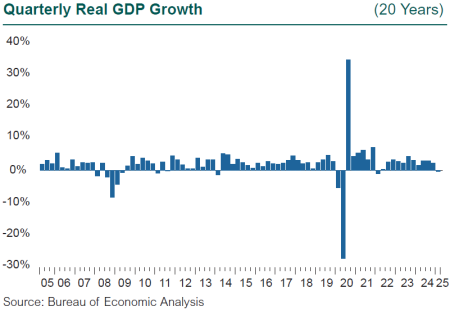
U.S. GDP fell by 0.3% (annual rate) in 1Q25, the first quarterly decline since the pandemic. While GDP grew 2.8% in 2024, the third year in a string of strong growth, the sharp reversal in 1Q surprised no one. Markets believed a recession was coming at the start of last year. The Federal Reserve telegraphed that it was considering rate cuts as early as 1Q24 and finally acted in September, despite the seeming lack of compelling evidence to support the need to ease. The leading indicators listed above started flashing recession signs in 4Q24, maybe earlier, as both consumer and business sentiment showed growing unease and caution about spending. In the PMI data from S&P, it is important to note that U.S.-based manufacturers, the intended beneficiaries of tariffs, were split. Those competing with imported final goods reported positive sentiment, while those that rely on inputs from around the globe were more cautious. Last year was marked by a tumultuous U.S. presidential election, looming potential trade conflicts, and geopolitical upheaval spread around the world. Actors in the economy were clearly preparing for potential uncertainty in 2025, but it would be safe to say few were expecting the extent of the tariffs announced in early April and the resulting large market impact.
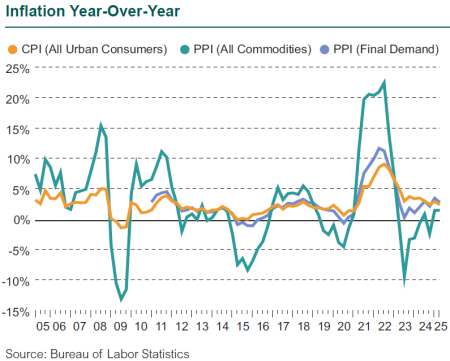
In contrast to the drop in GDP, underlying economic data still looked solid through 1Q25. The U.S. economy added another 228,000 jobs in March, well above the rate that signals expansion, and the unemployment rate remains near a historic low at 4.2%. One sign of labor market normalization is the ratio of the number of unemployed looking for work to job openings; after dropping to 0.5 following the pandemic, the tight labor market appears to be loosening, with this ratio rising to 1.0 in March. However, the official data do not capture the impact of a sharp drop in immigration (both legal and illegal) and mass deportations of immigrants stated to be in the country without authorization, particularly on the labor market that serves the agriculture, construction, and services industries; these sectors are likely to face severe labor shortages in 2025 and thus pose a threat to labor costs. Inflation as measured by the CPI dropped to 2.4% in March, while average hourly earnings rose by 3.8% during 1Q25, meaning real income continues to rise. The economic data and the GDP report for 1Q depict an economy that may be on the precipice of greater change.

Three details in 1Q GDP bear pointing out. First, we saw a surge in imports, as businesses and consumers likely stocked up in advance of the tariff announcements, and these are counted as a negative in the National Income and Product Accounts (NIPA) and must be subtracted from consumer, investment, and government spending before calculating GDP. Net exports—exports minus imports—fell by 50% annualized in 1Q and required a 5% reduction in the NIPA data before calculating GDP. Note that imports are an accounting variable but not a component of GDP. Second, one of the positive contributors to GDP was inventory building of products, some made in the United States, notably consumer goods such as drugs, perhaps in anticipation of rising prices from tariffs. Third, physical gold and silver imports as investments surged over the last year, and these are now excluded from consumption. GDPNow estimates from the Atlanta Fed during 1Q pointed out the impact of gold on GDP. Taking large gold imports out of consumer spending reduces total imports. One final note, the impact of the California wildfires is muted in GDP, since the destruction of fixed assets (structures) does not impact GDP or incomes directly.
Disclosures
The Callan Institute (the “Institute”) is, and will be, the sole owner and copyright holder of all material prepared or developed by the Institute. No party has the right to reproduce, revise, resell, disseminate externally, disseminate to any affiliate firms, or post on internal websites any part of any material prepared or developed by the Institute, without the Institute’s permission. Institute clients only have the right to utilize such material internally in their business.

