While the second quarter saw a public securities rally, private equity metrics such as fundraising and private M&A exits plunged by count—but dollar volumes held relatively steady as larger transactions were able to proceed. Only IPOs increased in the second quarter, supported by the public market rally. Average buyout company price levels fell more than 20% from 2019’s record high, with sellers pulling back and visibility into future profits (or losses) uncertain.
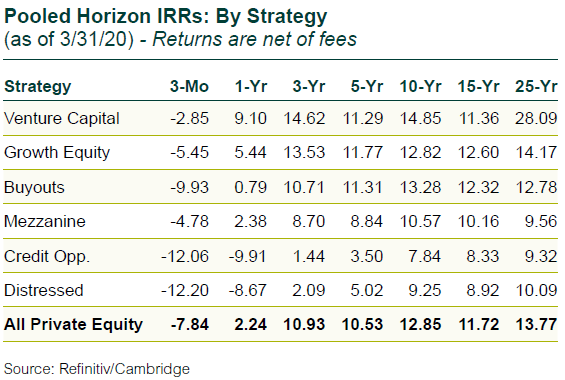
Private equity returns in the first quarter fell, but by less than half of public equity’s decline, an attractive characteristic of the asset class to institutional investors.
Fundraising: Still a Strong Favorite
- Investor demand for private equity remains strong.
- But fundraising is expected to dip as general partners (GPs) slow the deployment pace of their current funds, resulting in fewer new funds coming to market.
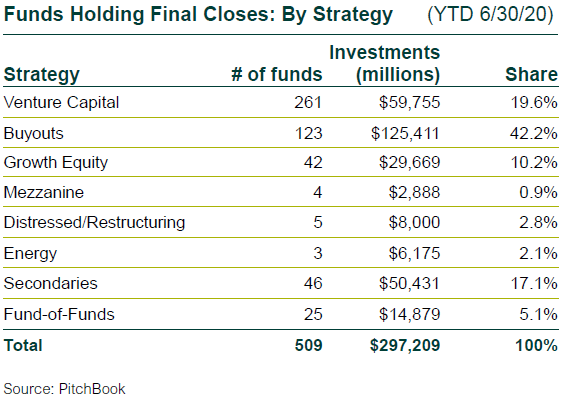
- First-half final closes were tilted to large funds. The fund count of 509 fell 25% from 2019’s mid-mark, but the commitments closed of $297 billion rose 10%.
- Secondaries are poised to have a large annual increase as the strategy is viewed as a low-risk approach to capture any further market dislocations.
Buyout Investments: Price Discovery and Triage
- Uncertainty regarding future earnings made it hard for willing buyers and sellers to arrive at mutually agreeable transaction prices, and also impacted the ability to borrow from more cautious lenders. GPs are spending more time on existing portfolios to best position companies for the economic downturn.
- The number of transactions for the quarter totaled 973, down 51% from the first quarter. Dollar volume fell 29%, hitting $75 billion.
- The mid-year investment count and dollar volume declined 32% and 41% to 2,971 and $181 billion, respectively, compared to the first half of 2019.
Prices Drop from 2019’s Previous Record Highs
- Buyout prices plummeted in the second quarter after just a slight dip in the first quarter. Average buyout prices fell to 9.2x EBITDA, 2.3x lower than the record high average buyout pricing for the full year 2019. Average leverage multiples fell to 4.9x from 5.8x for all of 2019.
- Surprisingly, equity invested in companies as a multiple of EBITDA in the first half fell more than debt, so equity is a smaller component of capital structures in recent transactions.
- While average prices have dropped to a level last seen four years ago, values are still not particularly a bargain by historical standards.
VC Investments: Slower Pace, Larger Companies
- Venture capital (VC) investments also declined, but by a lesser magnitude than buyouts. The number of rounds of financing in the second quarter fell by 20% to 5,741 versus the first quarter, but the announced dollar volume rose 2% to $65 billion.
- First-half figures exhibited less momentum, with the count down 35% to 12,939 rounds, and announced fundings down 4% to $129 billion.
- Large transactions continued to dominate with later-stage rounds garnering 68% of fundings. In the first half there were 79 unicorn financings (VC companies with valuations of over $1 billion) totaling $30 billion.
- Venture prices generally rose for earlier-stage rounds during the quarter, but larger later-stage investment prices fell an average of 6%.
PE-Backed M&A Exits: Some Big Movers
- In line with general M&A declines in the second quarter, the private equity-backed M&A exit count was down 59% to 219. Conversely, dollar volume leapt 68% to $121 billion.
- The jump was driven by some mega exits including household names such as T-Mobile by Softbank, and Sprint by Hellman & Friedman, Providence, and others.
- The first-half exit count fell 39% to 753, with a 27% decrease in dollar volume to $193 billion.
PE-Backed M&A IPOs: ‘Rally Ho, Old Chap’
- The second quarter public market rally cracked open the IPO window for private equity-backed IPOs.
- The count rose by 15% to 15 offerings, and 57% by total raised to $11 billion.
- Year-to-date totals fell 50% by count to 28, but the total float rose 13% to $18 billion.
Venture-Backed M&A Exits: Private Sales Slow
- Venture capital exits during the second quarter fell 31% to 283, but announced proceeds jumped 35% to $23 billion. Similar to private buyout exits, two sales totaling $8.9 billion (Forty Seven and Woowa Brothers) drove the anomalous leap in dollar volume.
- First-half venture-backed M&A exits fell 26% by count to 694, and proceeds were down by 51% to $40 billion.
Venture-Backed IPOs: Another Bright Spot
- The number of venture-backed IPO exits in the second quarter jumped by 40% to 74, and the combined new issuance leapt 83% to $11 billion.
- The mid-year total IPO count is up 27% to 127 offerings, but dollar volume dropped 41% over the first half of 2019 to $17 billion of aggregate proceeds.
- A year ago we were in the middle of a unicorn stampede with firms like Uber, Pinterest, and Slack making debuts, so the lower first-half dollar volume is not surprising.
Returns: Private Equity Lends Portfolio Support in 1st Quarter
- U.S. public markets crashed in the first quarter (Russell 3000 down 20.9%) suffering the initial impact of COVID-19. Private equity was down as well, but only by 7.8% for diversified portfolios. The Callan All Institutional Investor Database Group showed a median decline of 12.5%, so private equity helped reduce total portfolio volatility.
- The Refinitiv/Cambridge private equity database outperformed broad public equity indices over all horizons.
- Given private equity’s continuing attractive return profile and outperformance versus public equity, we think that it will continue to grow in popularity with institutional investors, subject to their individual liquidity considerations.