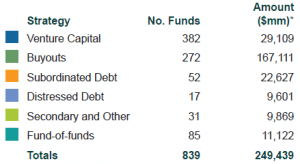
As 2017 progressed, the private markets stayed on track to set records for fundraising. New private equity partnership commitments totaled $249.4 billion through the third quarter, up 29% from the same period in 2016, according to Private Equity Analyst, and on a pace to top the record $312 billion raised in 2016. And over three quarters, 839 partnerships were formed, a leap of 63% from the prior period.
“Mega” funds have seen the biggest increase of all fund sizes year to date. The capital raised by these funds grew 60% to $77.4 billion compared to the same period in 2016.
Buyout prices continue to increase, with the trailing EBITDA purchase multiple through the first three quarters of 2017 at 10.23x compared to 2016’s 9.71x, according to Standard & Poor’s. Current valuations surpass the peaks attained during the lead-up to the Global Financial Crisis (GFC), when EBITDA multiples hit 9.3x in 2007. Leverage multiples are also creeping up, with the unadjusted debt/trailing EBITDA for large corporate loans through the first three quarters of 2017 at 6.05x, according to S&P. In 2016, the figure was 5.63x, and in 2007—prior to the GFC— the multiple peaked at 6.23x.
Funds Closed 1/1/17-9/30/17
While LIBOR rates continue to increase at the margin from their post-GFC lows, syndicated loan spreads have tightened, a reflection of the ample liquidity in the credit market and consequently higher purchase and leverage multiples. Loan spreads relative to LIBOR and fees peaked at 797 basis points in 2009 from the 2005 low of 261 bps. Through the first three quarters of 2017, spreads stood at 416 bps.
Buyout M&A exits for the first three quarters totaled 483, according to Buyouts, up 21% from the 400 in the same period in 2016. The announced deal value increased 1.3% from the same period in 2016 to $68.6 billion.
New investments in VC companies totaled 5,948 rounds in the first three quarters, falling by 12% from 6,726 in the same period in 2016, according to the National Venture Capital Association (NVCA). Announced deal value hit $61.4 billion through the first three quarters, up 6% from $57.8 billion in the comparable period. The per-round deal value increased 17% through the first three quarters compared to the same period in 2016.
If the current investment pace holds, the number of deals getting financed on an annual basis will be the lowest since 2012, when 7,872 financing rounds were completed. However, the total dollars invested are on track to hit another yearly high.
The NVCA notes that the rise in the total invested is largely due to an increase in financings and valuations associated with unicorns (companies valued in excess of $1 billion). The deal-round values for non-unicorns increased 15% year-over-year in the third quarter compared to 267% for unicorn deals during the same time period. Excluding the valuations assigned to unicorns reflects a relatively more muted investment environment, with investors capitalizing only on higher-conviction opportunities.
Private equity returns for periods ending June 30, 2017, were positive across all strategies and all time horizons. Buyouts continue to generate strong performance both on a near-term and longer-term basis; Venture Capital and Distressed out-performed over longer market cycles given the episodic nature of the strategies.
21%
Increase in buyout M&A exits for the first three quarters of 2017 compared to the same period in 2016