Capital Markets

In Context: Market Volatility

In Context: Market Volatility
clock
2 min, 19 sec
Yesterday, equity market volatility touched off a host of headlines and commentary. Here, we present a longer-term context around market volatility.

Market volatility can be measured in a number of ways. We address three in the following exhibits, two historical (or experienced) and one expected (or implied).

Sizable Daily Moves

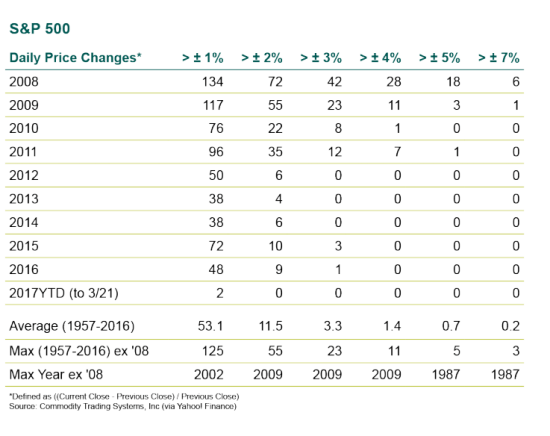
The table below shows a simple aggregation of the number of days the S&P 500 exhibited a sizable move, positive or negative, in a given calendar year. The data go back 60 years to the modern inception of the index in 1957.

Yesterday’s 1.24% decline was the first 1% move to the downside in more than 100 trading days. October 11, 2016 was the last 1% decline and coincidentally also a 1.24% loss.

Including up days, yesterday was also only the second 1% move thus far in 2017 (1.4% rise on March 1). When put in a historical context, this is an astoundingly low level of observed daily volatility. On average since 1957, more than 50 days each year experience a ±1% move on the S&P.

The table below also makes clear just how dramatic the 2008 experience was. Over 253 trading days in 2008, the S&P 500 Index moved ±1% at least every other day and ±3% almost weekly.
S&P 500

Historical Standard Deviation

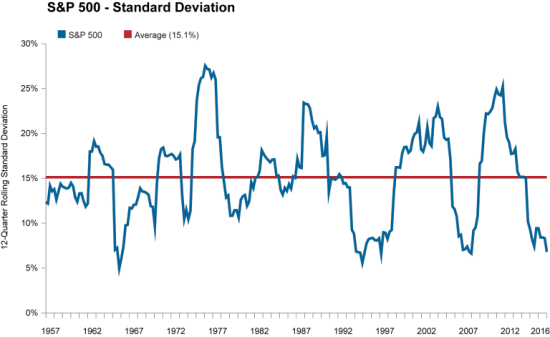
Historical standard deviation of returns is a second frequently used measure of market risk. Over the same timeframe as above, the S&P 500 has averaged 15.1% standard deviation measured quarterly on a rolling 3-year basis, albeit with substantial variance. By the end of 2016 this measure of market volatility had plunged to 6.8%, a level not seen since before the 2008 financial crisis and only experienced at two prior times over the past 60 years.
S&P 500 - Standard Deviation

Implied Volatility

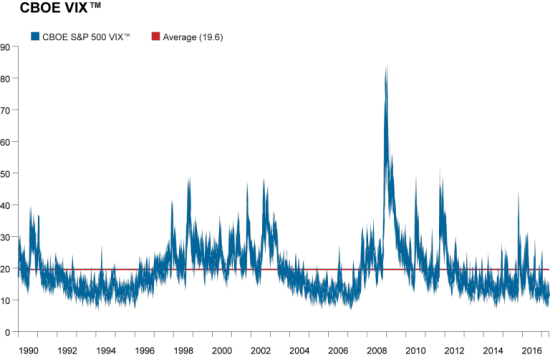
Finally, expected volatility can be derived from the market prices of index options — the oft-discussed CBOE Volatility Index® (VIX®). The VIX is frequently described as the market’s “fear gauge” as it measures the level of uncertainty implied by options values.

The measure is “unit-less,” making it useful for comparisons across assets and time horizons. The VIX has exhibited a long-term average of just under 20 dating back to the inception of data in January 1990. While “VIX” has come to be associated with the S&P 500, the Chicago Board Options Exchange now calculates VIX measures on more than 20 different indices across global equities, bonds, currencies, commodities, and time horizons.

More volatile assets such as crude oil exhibit higher levels of “VIX” (average Oil VIX is around 37) while less volatile assets exhibit lower readings (average 10-year US Treasury VIX is around 7). Generally, a higher (rising) reading for VIX represents more (increasing) expected near-term market volatility.

As with the two historical measures of volatility (daily price change and standard deviation), this forward-looking measure has been running well below its long-term average. So far, 2017 has not broken above 13 even with yesterday’s equity decline touching off a 10% spike in the reading. As markets began the day today on a quieter note, VIX is ticking back down after yesterday’s spike.
CBOE VIX

Circling back to the daily observed volatility that investors must learn to stomach: while yesterday was a notable downdraft, investors would be wise to keep a broader long-term historical context in mind before reacting to news headlines. Near-term volatility is not necessarily something to fear and may present interesting opportunities for those with longer time horizons.

Posted by

Share
Share on facebook
Share on twitter
Share on linkedin
Related Posts
Macro Trends

Risky Business Update: Our 2024 CMAs Change the Equation

Julia Moriarty
Julia Moriarty provides an update to our famous "Risky Business" pie charts using our latest Capital Markets Assumptions.
Operations

Callan’s 2023 Capital Markets Assumptions: A Behind-the-Scenes Look

Capital Markets Research
This blog post details the process and reasoning behind the Callan Capital Markets Assumptions for 2023-2032, and provides detailed information about ...
Macro Trends

Risky Business Update: After a Historic Year, What’s Changed?

Julia Moriarty
Julia Moriarty provides an update to our famous "Risky Business" pie charts using our latest Capital Markets Assumptions.
Macro Trends

Hedge Funds and Ukraine: A Guide for Institutional Investors

Joe McGuane
Joe McGuane analyzes hedge fund performance in 2022 and how managers are handling the volatility stemming from the invasion of Ukraine.
Operations

A High-Level Summary of the Callan 2022-2031 Capital Markets Assumptions

Capital Markets Research
This blog post details the process and reasoning behind the Callan Capital Markets Assumptions for 2022-2031, and provides detailed information about ...
Public Markets

Stocks Rebound in 2Q20; Fixed Income Sees More Modest Returns

Kristin Bradbury
U.S. stocks posted double-digit returns, with big gains in global ex-U.S. markets. Treasuries were range-bound during the quarter and most fixed incom...
Macro Trends

How We Developed Our 2019-2028 Capital Market Projections

John Pirone
Macro Trends

Risky Business Update: Challenges Remain for Today's Investors

Julia Moriarty
A Callan analysis found that investors in 2015 needed to take on three times as much risk as they did 20 years before to earn the same expected return...
Public Markets

Rocky Ride for Equity Investors at the End of 2018

Kristin Bradbury
The fourth quarter saw volatility return with a vengeance, especially in December. While economic worries played a role, a government shutdown, contin...
Macro Trends

Global Macroeconomic Environment: Is the Glass Half Full or Half Empty?

Kristin Bradbury

Callan Family Office

You are now leaving Callan LLC’s website and going to Callan Family Office’s website. Callan Family Office is not affiliated with Callan LLC.  Callan LLC has licensed the Callan® trademark to Callan Family Office for use in providing investment advisory services to ultra-high net worth clients, family foundations, and endowments. Callan Family Office and Callan LLC are independent, unaffiliated investment advisory firms separately registered with the Securities and Exchange Commission under the Investment Advisers Act of 1940.

Callan LLC is not responsible for the services and content on Callan Family Office’s website. Inclusion of this link does not constitute or imply an endorsement, sponsorship, or recommendation by Callan LLC of their website, or its contents, and Callan LLC is not responsible or liable for your use of it. When visiting their website, you are subject to Callan Family Office’s terms of use and privacy policies.