The Callan capital markets assumptions are developed at the start of each year, detailing our long-term expectations for return, volatility, and correlation for broad asset classes. These projections represent our best thinking regarding the outlook for equities, fixed income, real assets, and alternatives, and they are a critical component of the strategic planning process for our institutional investor clients as they set investment expectations over five-year, ten-year, and longer time horizons.
Our assumptions are informed by current market conditions but are not directly built from them since the forecasts are long term in nature. Equilibrium relationships between markets and trends in global growth over the long term are the key drivers, resulting in a set of assumptions that typically changes slowly (or not at all) from year to year. Our process is designed to ensure that the forecasts behave reasonably and predictably when used as a set in an optimization or simulation environment.
How the Callan Capital Markets Assumptions Process for 2022 Worked
We began the assumption-setting process for 2022 with the expectation that we might have to lower our return assumptions even further than we had for 2021, due to the market run and rich valuations in many equity asset classes.
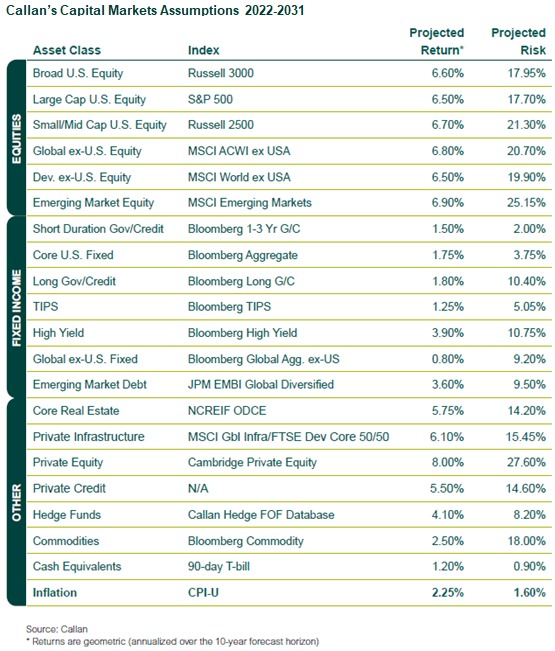
However, following our rigorous modeling and evaluation process, we made only a handful of adjustment to our suite of capital markets assumptions. We kept our 10-year geometric return expectations for all public market equity segments at the same level as one year earlier, centered around 6.50% for large cap U.S. We held our core U.S. fixed income assumption at 1.75% for the next 10 years. Returns for most private market equity-oriented asset classes—private equity, real estate—remained unchanged as well. We increased our 10-year inflation assumption to 2.25% from 2.00%, thereby lowering the real return for equity and core fixed income by 25 basis points. We lowered our equity return premium over cash, as we raised our cash return modestly, but held constant our projection of the equity risk premium over bonds. We are indeed concerned about rich U.S. equity valuations, which we reflect in our build-up of our equity return. The noticeable changes to our return assumptions lie with reductions to high yield, where spreads came in substantially and we expect spread widening over the assumption horizon, and in private credit.
Our white paper on Callan’s Capital Markets Assumptions, available at the link below, provides extensive detail about the process behind our assumptions, the economic environment in which they were made, and the specific factors that went into projections for individual asset classes. In addition, we have a web page with even more information here. And we have published a blog post that examines how our projections have done compared to actual returns over time.
The table below summarizes our risk and return projections for individual asset classes as well as the relevant benchmarks: