The NCREIF Property Index gained 1.7% during the first quarter (1.1% from income and 0.6% from appreciation). This marked the 33rd consecutive quarter of positive returns for the Index.
Industrial (+3.3%) was the best-performing sector for the eighth consecutive quarter with Office (+1.8%) and Apartments (+1.5%) also posting strong returns; Retail (+0.7%) was the worst performer. Retail and Hotels (+1.0%) were the only property types to experience negative appreciation returns, gaining only because of income returns. The West region (+2.2%) was the strongest performer for the seventh quarter in a row, and the East trailed (+1.2%). The West also was the only region with an appreciation return above 1%. Transaction volume decreased more than 22% to $8.95 billion, down from $11.50 billion in the fourth quarter, but up 28% from the first quarter of 2017. Appraisal capitalization rates fell 20 basis points to 4.35%. Transaction capitalization fell further, dropping 44 bps to 5.41%. The spread between appraisal and transaction rates decreased to 106 bps.
Occupancy rates dropped slightly to 93.5%, down 5 bps from the fourth quarter but up 57 bps from the first quarter of 2017. Apartment, Retail, and Office occupancy rates increased slightly while Industrial ticked down marginally.
The NCREIF Open End Diversified Core Equity Index rose 2.2% (1.0% from income and 1.2% from appreciation), a 13 bps increase from the fourth quarter of 2017. The appreciation return increased for the fourth quarter in a row and overtook income for the first time since the fourth quarter of 2015. Leverage dropped 3 bps to 21.1%.
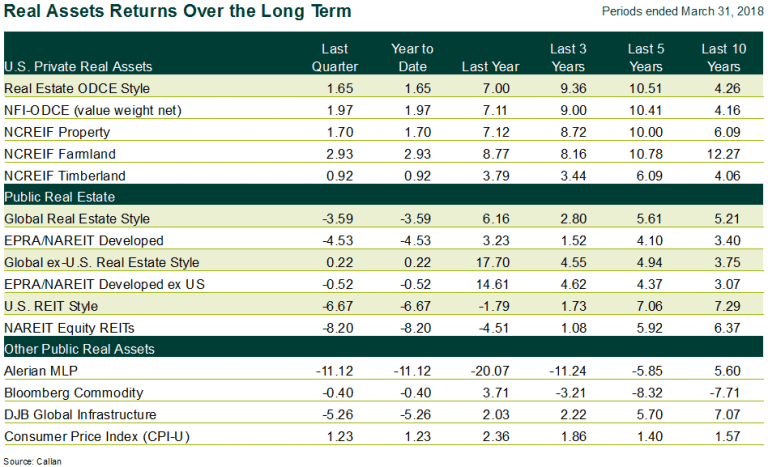
Global Real Estate Investment Trusts (REITs), tracked by the FTSE EPRA/NAREIT Developed REIT Index (USD), outperformed U.S. REITs but still lost 4.3% during the first quarter. The median active global REIT manager, as measured by Callan’s Global REIT Database Group, fell 3.5%, beating the Index. U.S. REITs, as measured by the FTSE NAREIT Equity REITs Index, lost 8.2% for the quarter. The median active U.S. REIT manager, as measured by Callan’s REIT Database Group, lost merely 6.6%, also beating the Index.
U.S. REITs had a terrible start to 2018, down 11.6% through the end of February primarily due to an increase in interest rates and concerns over a trade war between the U.S. and China. A stronger March offset some of the damage but was not enough to push performance into positive territory. Timber (+1.8%) and Infrastructure (+1.4%) were the only sectors to experience positive returns. Diversified (-15.8%), Specialty (-11.7%), and Retail (-11.2%) were hit the hardest. Strong earnings and a positive growth outlook for the broader economy helped buoy REITs toward the end of the quarter.
Europe, as represented by the FTSE EPRA/NAREIT Europe Index, outperformed the United States, only losing 0.9% in U.S. dollar terms. U.K. REITs outperformed their continental counterparts in dollar terms but fared worse in local currency terms. The region was held back by geopolitical concerns, and economic growth, while still positive, fell from the frantic pace of late 2017 to more normal levels.
The Asia-Pacific region, represented by the FTSE EPRA/NAREIT Asia Index, declined 0.3%, outperforming all other regions. Japan jumped 7.3% in U.S. dollar terms, due mostly to weakness in the American currency, easily outpacing its neighbors to be the best-performing country in the region. Foreign capital flowed into Japanese REITs (J-REITs) and helped boost prices, even as they experienced continued net outflows. Low vacancy and increasing rents also contributed to the large gains.