
Listen to This Blog Post
How Markets in 3Q26 Performed
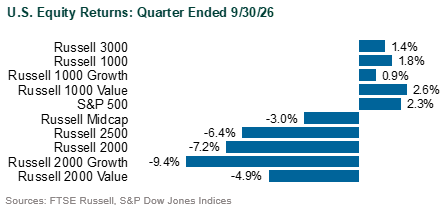
U.S. stock indices posted modest gains in 3Q, though performance was considerably more uneven following the strong advance in the prior quarter. Non-U.S. equities were broadly flat, with the MSCI ACWI ex-USA Index gaining 0.5%, while developed market performance was mixed. Emerging market equities declined modestly.
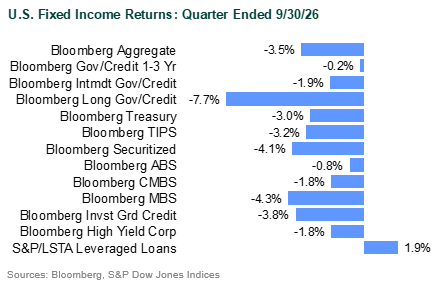
U.S. fixed income markets declined broadly in 3Q as Treasury yields rose sharply across the curve. Global fixed income also declined as government bond yields rose across most developed markets.
Listed real assets delivered sharply divergent returns, led by strength in commodities and energy-related assets.
Equities: The S&P 500 Index gained 2.3%, while the Russell 1000 Index rose 1.8%, supported by strong corporate earnings growth for the April-June period. In a shift from the previous quarter, value stocks (Russell 1000 Value: +2.6%) outperformed growth (+0.9%) as higher interest rates pressured more expensive growth-oriented stocks, energy stocks benefited from rising commodity prices, and momentum in AI-related names moderated. Small cap equities lagged sharply, with the Russell 2000 declining 7.2%, including a 9.4% decline for small cap growth.
Sector performance also diverged meaningfully. Energy (+14.1%) and Technology (+6.7%) led the market, while Health Care gained 6.2%. In contrast, Utilities (-12.0%), Industrials (-8.1%), Real Estate (-6.3%), and Consumer Discretionary (-5.3%) posted notable declines as higher interest rates weighed on rate-sensitive and economically sensitive areas of the market.
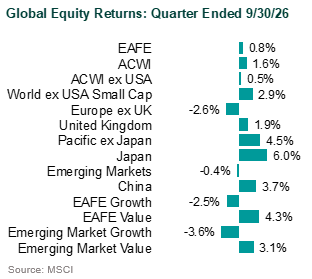
The MSCI ACWI ex-USA Index gained 0.5%, while developed market performance was mixed. Japanese equities (+6.0%) generated solid performance while euro zone equities declined 2.7%. Value also outperformed growth across developed ex-U.S. markets. Performance reflected a rotation away from some of the quarter’s earlier AI- and semiconductor-related leaders toward value and cyclical sectors, while stronger-than-expected corporate earnings provided support across several markets. Financials also benefited from higher domestic interest rates, particularly in banking and insurance shares. Although valuation concerns persisted, AI-related companies remained supported by continued investment and investor interest in the theme.
The MSCI Emerging Markets Index fell 0.4%, though performance varied significantly across regions. Within Asia, Taiwan gained 4.8%, while South Korea declined 9.6% after a strong first half of the year. Korean equities came under pressure as concerns around hyperscaler capital spending and rising competition from China weighed on semiconductor-related shares. India also underperformed (-5.6%), as elevated oil prices, higher interest rate expectations, and relatively demanding valuations pressured the market.
Fixed Income: The Bloomberg US Aggregate Bond Index fell 3.5%, while Treasuries declined 3.0%. The 2-year Treasury yield increased 74 basis points to 4.88%, while the 10-year yield rose 85 basis points to 5.29%, modestly steepening the 2s/10s segment of the yield curve. Inflation expectations also moved higher, with the 10-year breakeven inflation rate ending the quarter at 2.36%. Credit markets weakened alongside the rise in rates, with investment grade corporates declining 3.9% as spreads widened modestly. High yield fell 1.8%, with spreads widening roughly 42 basis points and lower-quality CCC-rated bonds declining 3.4%. Leveraged loans gained 2.0%, benefiting from their floating-rate structure amid higher short-term yields. Securitized assets also came under pressure, with MBS, CMBS, and ABS all down.
The Bloomberg Global Aggregate Index fell 2.5% on both hedged and unhedged bases. Yields moved higher in Japan, Germany, the U.K., France, and Italy, reflecting a broader repricing of inflation and policy expectations. Emerging market rates were more mixed, though both hard-currency and local-currency debt posted negative returns, declining 3.9% and 0.9%, respectively.
Municipal bonds were among the weakest areas of fixed income in 3Q, with the Bloomberg Municipal Bond Index dropping 6.4%. Shorter-duration municipals held up relatively better, with the 1-5 year index falling 2.1% compared with a 4.1% decline for the 1-10 year index. Tax-exempt yields moved sharply higher, with much of the adjustment occurring in September as the municipal yield curve flattened. Elevated new-issue supply and increased tax-loss harvesting added to technical pressure on valuations. By quarter-end, municipal bond tax-equivalent yields had risen to their highest levels since before the Global Financial Crisis.
Listed Real Assets: The Bloomberg Commodity Total Return Index gained 16.2%, while the S&P GSCI jumped 25.1%, driven by a 32.3% increase in energy commodities. Industrial metals (+6.6%), agriculture and livestock (+4.9%), and precious metals (+2.9%) also advanced, while gold gained 3.7%. Natural resource equities rose 10.2% and MLPs gained 1.9%, supported by higher commodity prices. In contrast, rate-sensitive real assets struggled as bond yields moved higher, with the FTSE Nareit Equity Index declining 6.1% and the S&P Global Infrastructure Index falling 7.9%.
Disclosures
The Callan Institute (the “Institute”) is, and will be, the sole owner and copyright holder of all material prepared or developed by the Institute. No party has the right to reproduce, revise, resell, disseminate externally, disseminate to any affiliate firms, or post on internal websites any part of any material prepared or developed by the Institute, without the Institute’s permission. Institute clients only have the right to utilize such material internally in their business.