Listen to This Blog Post
Since Callan published our annual Capital Markets Assumptions (CMAs) in January, projecting the return and risk for major asset classes over the next 10 years, many clients have asked, “How does Callan model the expected return for stocks?” And a natural next question is, “Can the model be improved upon?”
We explain that there are key drivers in our model, including real earnings growth and inflation for capital appreciation, as well as dividend yield and net share buybacks for companies to return cash to shareholders. The most controversial driver, however, is always valuations. If some metric for valuations, such as the price-to-earnings ratio, changes over the next 10 years, then it would also be a key driver of returns. Callan’s philosophy is conservative with regard to valuation adjustments, meaning that they should be rare, and that they should be small when they do occur.
“It’s tough to make predictions, especially about the future.”
–Danish proverb
The Challenges for an Equities Model
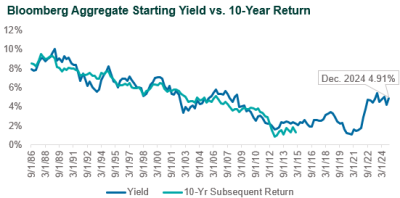
Conservatism in setting an expected return is especially important for stocks because stock returns are so hard to predict. This stands in contrast to bonds, which have contractual repayment terms. A chart comparing the starting yield on the Bloomberg US Aggregate Bond Index compared to the actual subsequent 10-year return shows that bond returns can be relatively easy to predict. While many people wish that a comparable chart existed for stock returns, the truth is that it does not.

It is tempting to assume that valuations play the same role for stocks that yields do for bonds. The danger lies in placing an extremely high level of confidence that valuations will “return” to an assumed level (perhaps some kind of long-term average) over a specific period. This can lead to extraordinary views about market returns that can persist for many years.
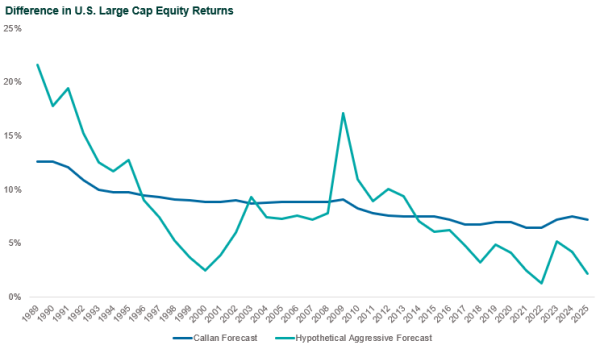
We think a better approach is to wait for valuations to reach some extreme level, at least a full standard deviation away from long-term averages, and assume a relatively small tendency for this to reverse. This approach led us to reduce our expected return for U.S. large cap stocks in the 2025 CMAs by 25 basis points. This results in an expected return of 7.25% for large cap U.S. stocks, which compares to 4.75% for core U.S. fixed income. While it’s not the most common approach, we’ve come across expected returns published by others that show expected returns for stocks on par with or below those of bonds. Because stocks are much more volatile than bonds, this would result in a relatively extreme portfolio construction model compared to what typical institutional investors are used to seeing.
Because Callan has been producing annual CMAs since 1989, our forecast errors (the difference between actual subsequent returns and the expected returns we published at the beginning of the period) can be evaluated. Would Callan have done better by being more “aggressive” with valuation adjustments when we came up with expected returns for large cap U.S. stocks historically? Aggressive here is defined as higher expected returns when valuations are cheap and vice versa. Or was Callan’s conservative approach the better approach for our CMAs?
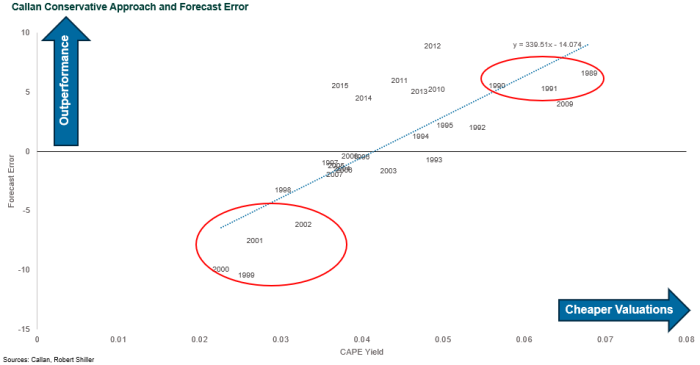
With perfect hindsight, there are seven years, or two clusters, when it would have meaningfully helped to be more aggressive. Below, valuation is defined by the CAPE yield (one divided by Robert Shiller’s Cyclically-Adjusted Price-to-Earnings Ratio).

When seeing a chart like the one above, one should always question to what extent there is actually a causal relationship at play. Callan’s most inaccurate year, for example, was 1999 (9% expected return vs. -1.4% for the 10-year period ending 12/31/08). Robert Shiller argued that valuations made the Dot-Com Bubble predictable in the beginning of this period. Does knowledge of valuation levels at the beginning of 1999 tell an investor whether or not the market will crash during the Global Financial Crisis in 2008? Skepticism is warranted.
If Callan had been more aggressive with valuations (flattening out the blue line of best fit above), what would expected returns look like hypothetically? The chart below shows expected returns would be very inconsistent and institutional investors may react poorly to being told, for example, that 10-year returns on large cap U.S. stocks would be less than 1.5% in 2022.


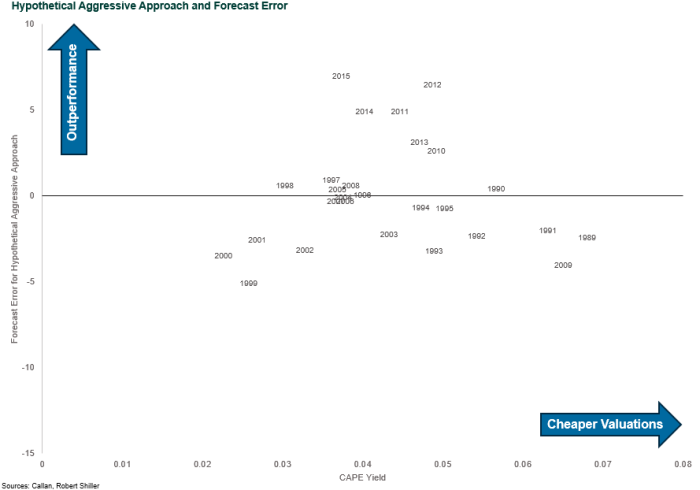
Under the hypothetical aggressive forecast, there is not much improvement in forecast errors given that the goal of this hypothetical model was to get as close to zero as possible. In about one quarter of all years, forecast error actually increases.
Disclosures
The Callan Institute (the “Institute”) is, and will be, the sole owner and copyright holder of all material prepared or developed by the Institute. No party has the right to reproduce, revise, resell, disseminate externally, disseminate to any affiliate firms, or post on internal websites any part of any material prepared or developed by the Institute, without the Institute’s permission. Institute clients only have the right to utilize such material internally in their business.

