
Listen to This Blog Post
The exuberance in the U.S. stock market during 2026 is eye-opening, with the S&P 500 setting 24 record closing highs during the first half of 2026 (or roughly once every five trading days). During 1Q, we saw hesitation on the part of equity investors, only to witness a strong reversal in 2Q, where 9 of 11 sectors posted gains.
The only losing sectors were Energy and Utilities. Oil and gas prices rocketed up in the face of the Iran war, and the contention over the Strait of Hormuz seriously squeezed global energy supplies. We may think of the U.S. as energy independent, but oil and gas prices are set in the global market.
Investors’ love for things AI was the prime driver of the U.S. stock market, and this love has extended to emerging market equity and to a lesser extent the developed ex-U.S. markets.
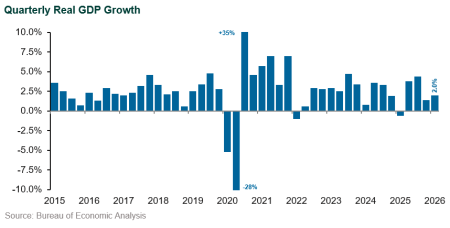
Boundless enthusiasm in the stock market through the first half of 2026 sits in stark contrast to the on-the-ground economic news unfolding, like slowing job growth (just 57,000 new jobs in June, below the 100,000 needed to show economic expansion) and cooling GDP growth (1.5% for 2Q26, less than the 2.1% predicted by the consensus). Dragging down consumer and business sentiment are the sustained rising everyday cost of living for consumers, supply chain bottlenecks, higher prices for intermediate goods for businesses from tariff policy, and the very real consequences to the global energy system from a war in Iran that is over 150 days old with no evident exit plans. Exuberance and reality will need to be squared at some point.
Drilling Down Into the 2Q26 Economy
Headline inflation fell by 0.4% in June but is still registering 3.5% (year-over-year), down from 4.2% in May. The core inflation index (less food and energy) did not change in June, and core is up 2.6% over the past 12 months. The inflation metric upon which the Federal Reserve focuses is the Personal Consumption Expenditures (PCE) deflator, which tends to lag CPI-U. The deflator rose 3.3% year-over-year in June 2026. The inflation data through June does not reflect the renewed jump in energy prices in July as the Iran war continues and as new tariffs have been imposed.
Underneath headline inflation, key prices squeezing companies and consumer budgets have been energy (8% of the CPI-U index), shelter (35%), and food (13%). The index for energy fell 5.7% in June, thanks to expectations that the war in Iran might be stopping (at the time of this print, oil prices were back up 15% in July). However, even with this June decline, gasoline prices are 26.7% higher than one year earlier, and fuel oil prices are 42.9% higher, providing serious upward pressure on costs and overall prices.
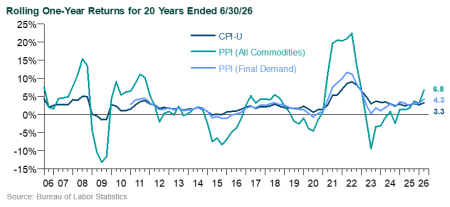
How we measure inflation is back on the hotseat. The shelter index, which includes rent and imputed rent for homeowners, is up 3.3% year over year, while food is up 3.0%. The calculation of the shelter index is a subject of eternal debate—how does one really compute the cost of a homeowner “renting” to themselves? The cost of a rental lodging is much clearer, and that inflation came in at 2.8% year-over-year in June.
A better question is how has the recent inflation experience compared to growth in income, and therefore real income (net of inflation) in particular? If wages have risen with inflation, if total compensation has risen with inflation, then households may be in better shape than headlines would suggest. The Bureau of Economic Analysis keeps detailed data on income by type (wages and salaries, interest income, proprietor’s income, transfer payments, rental income); employee compensation is the biggest component at 60%. Total personal income rose 3.9% in June year-over-year, while the employee compensation component rose 4.2%. Disposable personal income (after taxes) also rose 4.2%. Using the preferred PCE deflator, which rose 3.3%, would suggest each of these measures of income rose relative to inflation. Over one year, real disposable income in the U.S. rose 0.5%; over five years, real disposable income rose almost 6%.
However, the emotional impact of inflation is not to be discounted. First, even if the rate of inflation subsides to, say, 2%, prices are permanently higher unless inflation goes negative. Second, we lived without inflation for almost 20 years; the adjustment to inflation is painful and feels “unfair.” More importantly for the capital markets, inflation expectations inform Fed policy and market sentiment and will drive asset class returns across both ownership and debt assets. Fighting inflation involves raising interest rates, which is painful for capital users, for existing bond investors, and for evaluating equity investments. Higher interest rates can also be dangerous to politicians looking to retain voters’ confidence. New Federal Reserve chair Kevin Warsh has been thrown into this balancing act of managing inflation pressures and job growth (the two stated mandates for the Fed) as well as political and market pressure to meet expectations for two different masters.
Disclosures
The Callan Institute (the “Institute”) is, and will be, the sole owner and copyright holder of all material prepared or developed by the Institute. No party has the right to reproduce, revise, resell, disseminate externally, disseminate to any affiliate firms, or post on internal websites any part of any material prepared or developed by the Institute, without the Institute’s permission. Institute clients only have the right to utilize such material internally in their business.