Public defined benefit (DB) plans typically measure their financial progress on a fiscal year that ends June 30. Their announcements each year often lead to a lively discussion in the investment industry about which strategies performed best over the past year. But for a true long-term investor, a one-year return is almost meaningless … unless it isn’t!
Fiscal year 2021 was remarkable due in large part to the pure coincidence of timing. This particular year began a full quarter after the severe drop in capital markets caused by the COVID-19 pandemic. While the year missed that swift and painful plunge in March 2020, it did capture much of the rebound in markets, as fiscal stimulus and positive vaccine news propelled risky investments higher in late 2020 and into 2021.
The strength of the most recent fiscal year comes further into focus when comparing it to previous years. One needs to go back to 1985 to find a single year with a return higher than what the median public plan achieved during 2021 (all returns cited are for the median public pension plan in Callan’s public fund peer group).
Separating Past, Present, and Future
Such strong returns did much to improve the funded status (ratio of assets to liabilities) for public pension plans. The way pension math works, however, means that those funds with the highest funded status experienced the largest improvements because they simply had more assets on hand that experienced these strong returns. The most poorly funded plans did not experience the same improvements in funded status.
While it may be tempting to celebrate the strong fiscal year, many market forecasts, including those from Callan, expect much more modest returns. Callan’s capital markets assumptions anticipate a median return of about 6% over the course of the coming decade. This figure is short of most actuarial assumptions and well short of what most public plans have actually returned during their history.
To illustrate how different the future might be, let’s take a more detailed look at the past returns of public plans. The chart below plots the fiscal year returns of the median public plan for as far back as Callan has data (1976).
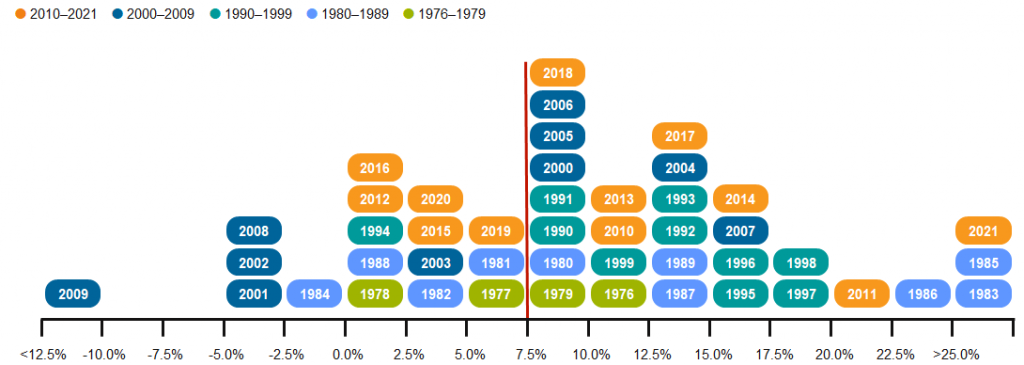
What is perhaps most striking about this table is how rare negative years have been (approximately 11% of the observations) and how truly painful 2009 was (-17.14%) compared to earlier fiscal year losses (the other four fiscal year losses average -3.65%). In fact, the loss experienced during fiscal 2009 due to the Global Financial Crisis was greater than all the other fiscal year losses combined.
What is also striking is how strong the rest of the years were. The average fiscal year return between 1976 and 2021 was 9.7% and the median was 9.6%. Both figures were well above investment consultant expectations and actuarial return assumptions. The standard deviation was 9.6%, meaning that public plan stakeholders have generally seen two-thirds of the fiscal year returns fall within +/-9.6% of the median of 9.6%.
A close look at the histogram reveals some interesting observations on these very strong past results. First, returns during the 1980s were pretty favorable due in large part to gains from fixed income investing in an environment when interest rates declined significantly and public plans were more heavily weighted toward bonds. While public plans are oriented toward riskier investments these days—and those drove the strong gains in fiscal 2021—the outlook for bonds in a potential rising rate environment is modest at best. Second, most of the fiscal year returns have been well ahead of 7.5%, which was a common actuarial discount rate as many public funds migrated down from 8% toward the new average of 7.0%. Nearly two-thirds of all fiscal year returns shown were above the artificial 7.5% threshold. There is a common refrain that modest investment results have led to public pension plans being unfunded, but the actual performance over the past 46 years indicates something different. True, the decline during the GFC was devastating, but long-term returns in general have been strong.
Public DB plans have actually achieved much better returns—on average—than expected. Despite that, they continue to be plagued by underfunding due to contribution rates that are often inadequate to cover the benefits promised to participants. As public DB plan stakeholders look to the future, they should expect more modest returns in the next 10 years than what they have seen during the previous 46 years. In this environment, contributions from both employees and employers will be important in maintaining financial health.