By David Welsch and David Zee
U.S. Bonds: Fear, Uncertainty Roil Markets
The 10-year U.S. Treasury yield marched steadily higher through most of January and February in response to positive economic data, then equity market weakness and concerns over a looming trade war led to falling yields in March. New Fed Chair Jerome Powell announced his first rate hike (as widely expected) in March, raising the Fed Funds target rate to 1.50%–1.75%. The 10-year U.S. Treasury yield climbed to a peak of nearly 3% during the quarter before closing at 2.74%, 34 basis points higher than at year-end. Two-year U.S. Treasury note yields rose nearly 40 bps to 2.27%, the highest since 2008, and the note fell 0.1% for the quarter, while the 10-year Treasury dropped 2.4% and the 30-year Treasury plunged almost 4%. Interest rates rose approximately 30 bps across the U.S. Treasury yield curve. TIPS outperformed nominal Treasuries, and the 10-year breakeven inflation rate rose to 2.05% from 1.96% at year-end.
The Bloomberg Barclays US Aggregate Bond Index fell 1.5%, with corporate and securitized sectors underperforming Treasuries. Volatility picked up across risk assets as geopolitical uncertainties took center stage; market expectations reflect the possibility of four rate hikes in 2018, up from a projected three at the end of 2017. In a sharp reversal from 2017’s relative performance, investment grade corporates underperformed like-duration Treasuries by 80 bps during the quarter and dropped 2.3%. Investors were fairly sanguine as they reassessed fairly healthy balance sheets juxtaposed with fair-to-rich valuations. New issuance was down 13% when compared to a similar time period a year ago, yet demand remained strong with oversubscriptions by two to three times. Outside of investment grade, the Bloomberg Barclays High Yield Index fell 0.9% while the S&P/LSTA Leveraged Loan Index, which includes floating rate loans and thus benefited from rising rates, rose 1.4%.
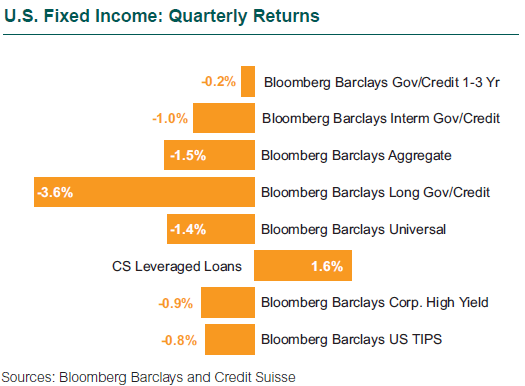
High yield corporates dropped 0.9% and outperformed the Aggregate. Corporate fundamentals remained healthy as earnings growth supported debt coverage. Default rates remained benign because many companies had already reorganized debt in 2016. About 75% of new issuance proceeds were used for refinancing. Valuations remained near historical highs.
Bank loans rose 1.4% and outperformed the Aggregate. Healthy balance sheets, strong demand for collateralized loan obligation (CLO) formation, and higher short-term interest rates bode well for the sector this quarter.
Global Bonds: Currency Changes Drive Returns
The Bloomberg Barclays Global Aggregate Index (hedged) fell 0.1% (versus a gain of 1.4% for the unhedged version) as developed non-U.S. fixed income market returns were helped by U.S. dollar weakness. Generally, currency movements drove fixed income returns across countries more than interest rate changes in the first quarter. The U.S. dollar has been hurt by growing worries over a trade war with China as well as signs that rates may be poised to rise in other countries as global economies improve. As in the U.S., global credit underperformed government bonds.
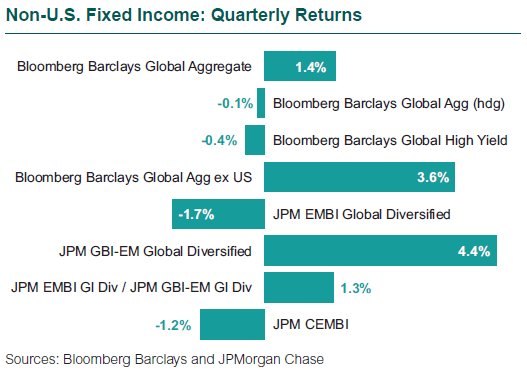
Local currency emerging market debt was a top-performing asset class in the first quarter; the JPM GBI-EM Global Diversified gained 4.4%. Returns were positive for most countries in local terms and further boosted by U.S. dollar weakness. U.S. dollar-denominated emerging market debt did not perform as well, dropping 1.7% as measured by JPM’s EMBI Global Diversified Index.
Muni Bonds Lag Treasuries but See Inflows
Municipal bonds underperformed Treasuries in the first quarter in spite of shrinking supply and continued inflows to the sector. As a result, the ratio of the yield of AAA-rated 10-year municipals relative to the 10-year U.S. Treasury climbed to 89% as of quarter-end, up from 81% at the end of the year. Further, the municipal curve steepened as longer maturities underperformed. Municipal bond fundamentals broadly remained strong, and Moody’s reported that ratings upgrades outpaced downgrades for the third consecutive year in 2017. The Bloomberg Barclays Municipal Bond Index dropped 1.1% and the shorter duration 1-10 Year Blend Index fell 0.7%.