Callan’s 2021 Investment Management Fee Study, our ninth analysis of what institutional investors pay for asset management, examines fee levels and trends across multiple asset classes and mandate sizes, for both active and passive management. The study reflects trends for 2020 fees, and the data for this study were collected and curated using Callan’s proprietary investment manager database, actual client fee schedules, and Callan’s proprietary client performance reporting database.
Our fee dataset includes mandates run by over 300 investment firms for over 160 institutional investors, representing $598 billion in assets under management (AUM) and $1.4 billion in total fees paid. The study covers a total of 21 different asset classes, both public and private. It also encompasses many institutional mandate vehicle types including separate accounts, commingled funds (including collective investment trusts), and various partnership types. Mutual funds are excluded from this study.
In this blog post, I’ll lay out the methodology we used to conduct this survey and highlight some of our key findings. The full study can be accessed through the link above.
The actual fee dataset for client mandates was derived from client fee schedules and our performance reporting database. We next reviewed the resulting raw dataset for completeness and accuracy. The final clean dataset was then categorized by parameters such as active/passive, asset class, account size, inception date, and investment manager product. Unique mandate size ranges for analyzing each asset class were determined, balancing practical relevance with sufficient sample sizes. Throughout the study these actual client fees are labeled as “mandate actual” data.
By cross-referencing the manager products and mandate sizes in the actual fee dataset with the “published” or “standard” fee schedules for those products, we calculated the theoretical published fee (non-negotiated) for those same mandates. These theoretical client fees are labeled as “mandate published” data. This more focused view of published fees is very useful as it represents the starting fee ranges for successfully competitive products.
In order to provide a broader view of the competitive fee landscape, we also include the range of published fees for all products in the relevant asset class universe (regardless of having any client mandates). This range of published fees is labeled as “universe published.” Comparing this broader universe of published fees with the successful mandate published fees can be useful in determining what levels of published fees are competitive.
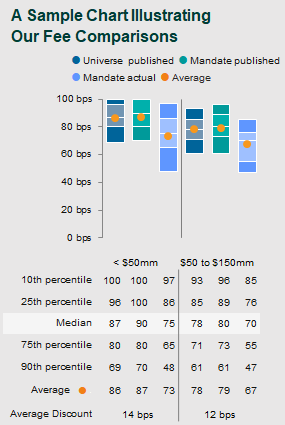
For each asset class, we show current industry fees from these three perspectives to illustrate and compare the fees for the total competitive landscape, the published fees for those products successfully winning mandates from Callan clients (pre-negotiation), and the actual fees those clients ended up paying in 2020 (reflecting any negotiated discounts). We also break down the analysis for each asset class by mandate size, and we show the distribution of fees across the full range of individual data points. Finally, we calculate the average discount between mandate published and mandate actual fees.
Other Ways Investment Management Fees Were Analyzed
We also analyzed the fee environment in a number of other ways, including:
- Vintage Analysis: Compares current actual fees for more recently incepted mandates (2016 and after) with those of older mandates (2015 and before) to better measure fee trends over the long term.
- Concentration Analysis: Examines the concentration of AUM, mandates, and actual fees/revenues by investment firm for each asset class.
- Fee Data: In addition to fees paid in basis points, we analyze average mandate sizes and average fees paid in dollars to gain insights into the health of the asset management industry.
Among our key findings:
- 97% of total fees paid in the study went to active managers (a 1% decline from our last study in 2019).
- Fees were also concentrated; 50% of total active fees went to 11% of the investment management firms.

- The highest average basis point fees went to hedge fund-of-funds (117 bps) and private real assets (84 bps).
- The lowest went to passive U.S. large cap (2 bps) and passive core fixed income (3 bps).
- Fee resilience was strongest for managers of private real assets, global ex-U.S. equity, and global ex-U.S. small cap equity.
- Total asset class dollar fees were down the most for U.S. large cap equity and hedge fund-of-funds.
- 38% of total study assets were passively managed, up 8% from 2019.
- U.S. smid/small/micro cap equity and U.S. large cap equity saw the largest increases in passive usage.
- Separate accounts were the most popular investment vehicle by far, at 62% of the products in the dataset.
- Public funds represented the largest share of assets under management by percent of mandates (44%) and percent of assets (68%).
For a full breakdown of fee levels by asset class, please find our study at the link below.