In a comprehensive update to our inaugural effort in 2020, Callan conducted our 2021 Private Equity Fees and Terms Study by analyzing 187 private equity partnerships, representing fund offerings in the market from 2018 through August of this year that were reviewed by Callan. This study is intended to help institutional investors better evaluate private equity funds, serving as an industry benchmark when comparing a partnership’s terms to its peers. It can also be useful for general partners, to determine how their fees and terms compare to other managers.
We focused on the following principal terms to provide a concise snapshot of the market:
- Minimum limited partner (LP) commitment
- General partner (GP) commitment
- Management fees
- Type of “waterfall”
- Carried interest percentage
- Preferred return
With this year’s study, we found consistency in some terms compared to our last study, but with some notable differences. These differences are more reflective of the specific funds included rather than broader changes to private equity terms. The biggest impact on the results stemmed from the increase in Callan’s coverage of small buyout and venture capital (VC) funds, which tend to have different management fees and carried interest levels than other strategies.
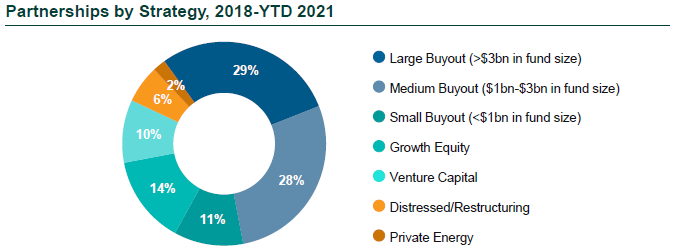
By strategy, the dataset is weighted toward buyout funds, which represented 68% of the partnerships. In terms of geography, the study is dominated by North American and global strategies, at 90% of the dataset. It also included a small portion of European strategies at 7% and Asian strategies at 2%.
Key findings of this year’s private equity study:
- Despite the pandemic, partnership terms continued to remain predominantly GP-friendly.
- After a dip in fundraising in 2020, demand for private equity in 2021 strengthened, resulting in many oversubscribed funds and quick fundraises.
- Minimum LP Commitment: Similar to the 2020 study, $10 million remained the most common minimum LP commitment, representing 49% of the dataset.
- GP Commitment: The median GP commitment has hovered around 2.5%-3.0% over the last four years with the aggregate median at 3.0%. The average has been slightly higher, ranging from 3.5%-5.1%.
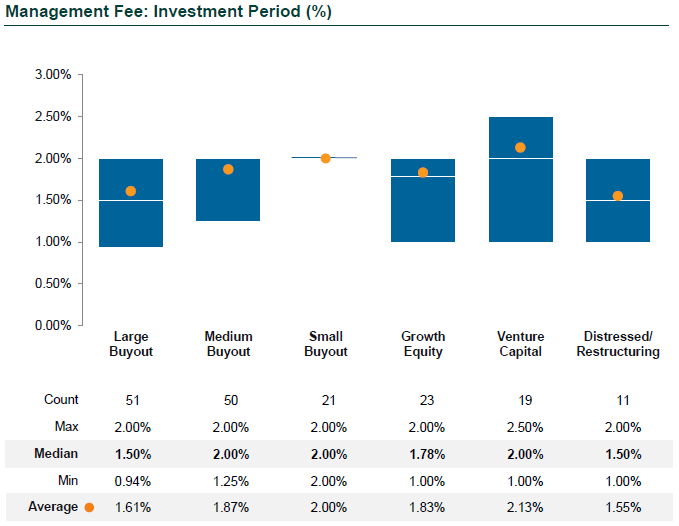
- Management Fee: We captured both the management fee paid during the investment period (typically the first 5-6 years of a fund’s life) as well as after. The median management fee during the investment period was 2.00%, a large jump from our last study, which showed 1.75%. The average also increased from 1.76% to 1.81%. These jumps reflect the expansion of the data set to include more VC and small buyout strategies, which tend to have higher fees, and fewer large buyouts, which tend to have lower fees.
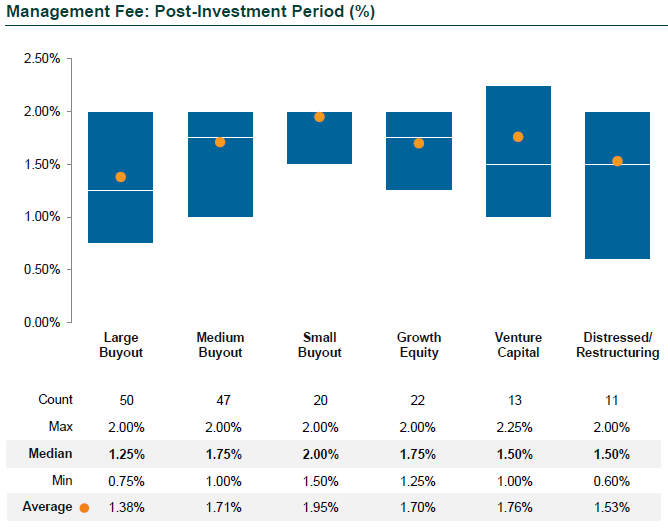
- Similarly, we also saw an increase in management fees post the investment period, from a median of 1.50% in our last study to 1.75%.
- During the investment period, management fees are almost always paid as a percentage of committed capital, which typically drops to invested capital post the investment period.
- Management Fee Offset: Every fund in the dataset offset management fees by any transaction, monitoring, or other fees paid to the GP. Most had a 100% management fee offset, although a few funds had a 99%, 80%, or 50% offset.
- Waterfall Type: Most funds had either an American (deal-by-deal) waterfall or a European (fund-as-a-whole) waterfall, meaning that carried interest is either paid to the GP on a per investment basis (more GP-friendly) or on a cumulative basis across all investments (more LP-friendly). The majority of the dataset had an American waterfall.
- Carried Interest: The most common carried interest percentage was 20%, with 86% of funds at this level.
- Preferred Return: The median preferred return has consistently been 8%. None of the funds had a higher preferred return. Many, principally VC and growth equity funds, did not have any kind of a preferred return.
- GP Catch-Up: We added the GP catch-up to this study for partnerships reviewed in 2020 and 2021, referring to the distribution of profits to GPs until they “catch up” to their full portion of cumulative carried interest, after the preferred return has been met. 87% of funds had a 100% GP catch-up.
With each year, the study’s dataset will broaden and become increasingly representative of the private equity industry. A larger dataset will enable our Alternatives Consulting group to expand our analysis to incorporate even more relevant comparisons of the private equity industry, to help institutional investors make more informed decisions about their private equity programs.