Callan’s 2023 Private Credit Fees and Terms Study is our inaugural study in the private credit space. The study is intended to help institutional investors better evaluate private credit funds, serving as an industry benchmark when comparing a partnership’s terms to its peers. This study can also be useful for general partners (GPs), to determine how their fees and terms compare to other managers.
This study includes 330 private credit partnerships, representing fund offerings reviewed by Callan that were in the market in 2016-YTD 2022 (as of 3Q). The data was collected through manager outreach and provided by the GPs. We focused on the following principal terms to provide a concise snapshot of the market:
- Management fees
- Type of “waterfall”
- Carried interest percentage
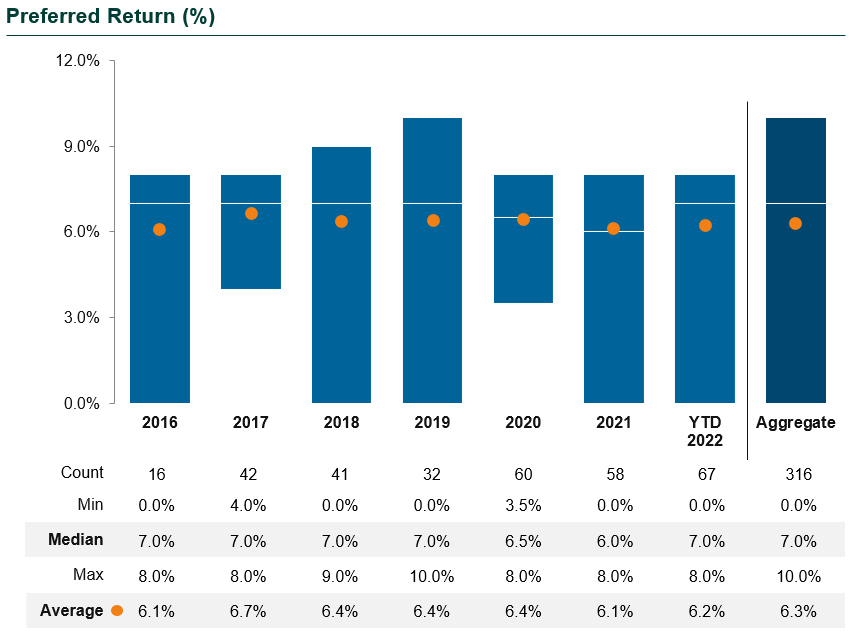
- Preferred return
Private credit terms have shifted since the emergence of the asset class after the Global Financial Crisis. Management fees and carry have evolved from 2% and 20% to a median of 1.5% and 15%. We have also seen increases in tiered pricing depending on fund leverage and commitment amounts. First-close discounts also became increasingly popular. Limited partner (LP) pressure to increase preferred returns back to 8% is expected to continue in the rising interest rate environment.
Highlights of the Private Credit Fees Study
- By strategy, the dataset is weighted toward direct lending, which represents 62% of the partnerships reviewed. Opportunistic credit comprises the second largest component. Post-COVID, there has been a pickup in opportunistic credit and multi-strategy fund allocations.
- The study is tilted toward North American and global strategies, which represented 86% of the dataset.
- The median GP commitment has hovered around 1%, with 60% of managers committing between 1% and 1.49%. A strong GP commitment is important to ensure adequate alignment between the general partner and its limited partners.
- The median management fee during the investment period (typically the first two to three years of a fund’s life) was 1.15%. During the investment period, management fees are almost always paid as a percentage of invested capital.

- Management fees during the investment period varied somewhat depending on the strategy type. Direct lending tended to have lower fees, partially because those fees are paid on a larger capital base. Opportunistic, distressed, multi-strategy, and asset-based lending tended to have the highest median management fees. Real assets and niche strategies had lower median management fees of 1.00%, partially due to the evolution of these asset classes and the fact that many niche strategies are smaller and newer and thus price their strategies below market to attract new capital.
- Direct lending and niche managers charged the lowest management fees during the post-investment period, with a median of 1.00% over the study period. Fee dispersion, however, has been wider than for some other strategy types. Opportunistic, distressed, multi-strategy, and asset-based lending strategies charged the highest management fees during the post-investment period.
- The majority of the dataset had a European waterfall (fund-as-a-whole, more LP-friendly), and this remained relatively consistent over the last seven years. The remainder, just under a quarter, had either an American (deal-by-deal, more GP-friendly), hybrid, or other waterfall.
- The most common carried interest percentage was 15%, with 36% of funds at this level.
- Median preferred returns were in the 6%-7% range, down from 8% earlier in the life cycle of private credit. The vast majority of partnerships used a compounded calculation for the preferred return. Many managers indicated that the impetus for bringing down the preferred return from 8% to 6%-7% has been due to the low interest rate environment. In the recent rising interest rate environment, LPs have been asking that managers raise preferred returns accordingly.
Callan plans to update this study on a regular basis; each time, our dataset will broaden and become increasingly representative of the private credit industry.
Disclosures
The Callan Institute (the “Institute”) is, and will be, the sole owner and copyright holder of all material prepared or developed by the Institute. No party has the right to reproduce, revise, resell, disseminate externally, disseminate to any affiliate firms, or post on internal websites any part of any material prepared or developed by the Institute, without the Institute’s permission. Institute clients only have the right to utilize such material internally in their business.