Listen to This Blog Post
How Global Markets in 4Q25 Did
U.S. equities advanced in 4Q25, extending gains from earlier in the year as investors navigated a more mixed macro backdrop while continuing to reward earnings resilience. Global ex-U.S. equities extended their lead over U.S. markets in 4Q. Fixed income markets posted positive but more subdued returns in 4Q as Treasury yields were broadly stable and volatility declined. Liquid alternatives delivered strong results in 4Q, led by commodities and precious metals.
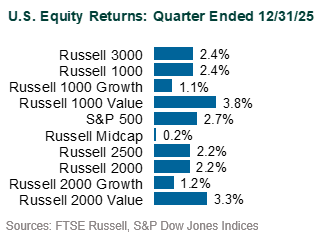
U.S. Equities: The S&P 500 rose 2.7% for the quarter, finishing the year up 17.9% and completing a historic recovery following the volatility of 1H25, when tariff announcements around Liberation Day weighed heavily on sentiment. Late in the year, performance leadership shifted as losses in technology stocks reflected growing scrutiny of AI-related valuations. Sector dispersion increased, with Health Care (+11.7%) delivering strong gains following earlier underperformance, while Information Technology posted more modest returns (+1.4%) as momentum in the AI trade slowed. Real Estate (–2.9%) and Utilities (–1.4%) lagged amid higher long-end yields, profit-taking, and increased uncertainty around AI-driven power demand. The style rotation of the last year continued, with Value (Russell 3000 Value: +3.8%) outperforming Growth (Russell 3000 Growth: +1.1%), while large cap equities (Russell 1000: +2.4%) slightly outpaced small caps (Russell 2000: +2.2%).
Market valuations remained elevated with the Shiller P/E ratio ending 4Q at its second highest level on record, only exceeded by the Dot-Com Bubble, while the market-cap-to-GDP Ratio (the “Buffett Indicator”) climbed to roughly 220%, underscoring the extent to which market gains have continued to outpace U.S. economic growth.
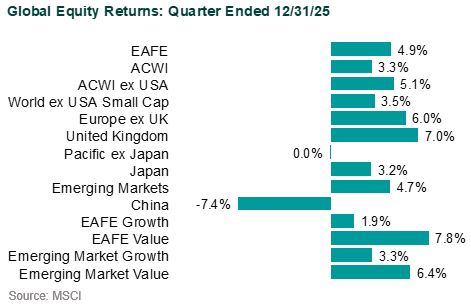
Global ex-U.S. Equities: The MSCI ACWI ex-USA Index rose 5.1% and posted its strongest annual performance relative to U.S. stocks (+32.4%) since 2009. The U.S. dollar was broadly flat against a basket of major currencies during the quarter and remained meaningfully lower year to date (DXY: -9.4%), marking its worst annual performance since 2017. European equities advanced broadly (MSCI Europe: +6.2%), with banks and defense stocks lifted by improving fundamentals and government spending measures. Japanese equities (+3.2%) also posted gains, despite a weaker yen, on strong earnings, continued AI-related demand, pro-growth economic policy signals, and ongoing corporate governance reforms.
Emerging market equities also delivered solid performance in 4Q (MSCI EM: +4.7%) and finished the year up 33.6%. Korean and Taiwanese equities led the index, driven by strength in semiconductor-related industries. Chinese equities declined during the quarter, including losses among large technology firms, as economic data pointed to slowing retail sales and industrial activity and President Xi Jinping signaled limits on future government stimulus.
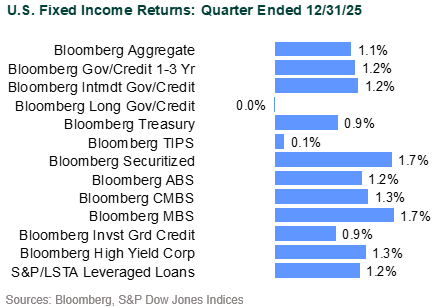
Fixed Income: The Bloomberg US Aggregate Bond Index gained 1.1% for the quarter, bringing full-year returns to 7.3%. The yield curve ended the quarter slightly steeper with front-end yields declining and longer maturities rising, following two 25 bps Federal Reserve rate cuts during the quarter. Inflation expectations edged marginally lower, with the 10-year breakeven rate declining modestly.
Credit sectors continued to benefit from supportive technicals and steady demand. Investment-grade corporates were up 0.8% in 4Q, underperforming Treasuries, while MBS (+1.7%), ABS (+1.3%), and CMBS (+1.3%) outperformed. High yield corporates advanced 1.3% (+8.6% YTD), with lower-quality segments lagging late in the quarter. Leveraged loans gained 1.2%, supported by stable short-term rates and continued CLO issuance. Municipal bonds continued their rebound following a challenging first half of the year, with the Bloomberg Municipal Index up 1.6% in 4Q and 4.3% for 2025. Despite historically heavy issuance, demand remained supportive, allowing municipals to finish the year in positive territory after a volatile start.
Global fixed income returns were mixed. The Bloomberg Global Aggregate Index returned 0.8% in 4Q and 4.9% for the year on a USD-hedged basis, while unhedged investors (+0.2% QTD, +8.2% YTD) benefited from currency effects. Central bank policy paths diverged, with the Fed and BOE cutting rates while the ECB held steady, and the BOJ raising its policy rate to the highest level in three decades. Emerging market debt outperformed developed markets, led by hard-currency sovereigns (JPM EMBI: +3.3% QTD, +14.3% YTD), supported by spread tightening and improving risk sentiment.
Liquid Alternatives: The Bloomberg Commodity Total Return Index rose 5.8% in the quarter and finished the year up 15.8%. Gold prices surged roughly 12.1%, capping a standout year (+64.4% YTD), as geopolitical uncertainty, central bank demand, and a weaker U.S. dollar bolstered safe-haven appeal. The S&P Global Natural Resources Index advanced 6.7% (+28.9% YTD), supported by strength in metals and mining, while the S&P Global Infrastructure Index was flat but delivered a strong annual return (+14.1%). REITs declined (FTSE Nareit: –1.6%) as higher long-term yields weighed on valuations, while MLPs gained 3.8%.
Disclosures
The Callan Institute (the “Institute”) is, and will be, the sole owner and copyright holder of all material prepared or developed by the Institute. No party has the right to reproduce, revise, resell, disseminate externally, disseminate to any affiliate firms, or post on internal websites any part of any material prepared or developed by the Institute, without the Institute’s permission. Institute clients only have the right to utilize such material internally in their business.