Stock and bond markets around the globe were down together for the first four months of 2022. How often does that happen? Is this a normal part of the ups and downs of the capital markets, or is something unusual going on? Did diversification fail us? Or are we misunderstanding how the capital markets interact in the face of stress?
Let’s focus on the U.S. market for this exercise, and broad recognizable market benchmarks. The S&P 500 Index was down 4.6% in 1Q22, while the Bloomberg US Aggregate Bond Index fell 5.9%. April was even worse, with the S&P 500 down another 8.7%, and the Aggregate off 3.8%. So for the first four months of the year, the S&P plunged 12.9% and the Aggregate dropped 9.5%. Other segments of the global equity and bond markets suffered similar pain, with the broad developed market MSCI World ex-USA Index down 11.1% and MSCI Emerging Markets down 12.2%, while the Global Aggregate bond index fell 11.3%.
Capital markets abhor uncertainty, and 1Q22 provided plenty. The Russian invasion of Ukraine upended expectations for an orderly slowdown from the surge in economic growth in 2021, and piled onto the spike in inflation that we expected to subside as supply chain bottlenecks cleared. Geopolitical upheaval, humanitarian catastrophe, and a Fed signaling a dedication to fighting inflation led to the down markets for both stocks and bonds.
How Often Stock and Bond Declines Occur
How unusual is this? Turns out, more often than we expected. Using data back to 1926, we found 37 quarters in which returns on stocks and bonds were both negative, just under 10% of all quarters over the period. Before now, the most recent quarter was 1Q18, and before that, the 2nd and 3rd quarters of 2008, as the Global Financial Crisis (GFC) began unfolding. In case you were wondering, the S&P 500 plunged 19.6% in 1Q20, while the Aggregate rose 3.1%. The frequency of down quarters for both stocks and bonds has been much lower since 1990 than in the first 60 years of the data set.
Looking at annual returns, there have been only two calendar years when stocks and bonds were both down, 1931 and 1969 (with a near-miss in 2018). So coincident quarterly declines in stocks and bonds are not that unusual, although more common in the 1970s than any other decade (nine times), and it has happened in only nine quarters in the three-plus decades that started in 1990. To develop a more nuanced look than simply decades, we examined the interest rate environments during this 96-year period.
In the table below we break the history of return data since 1926 into three regimes:
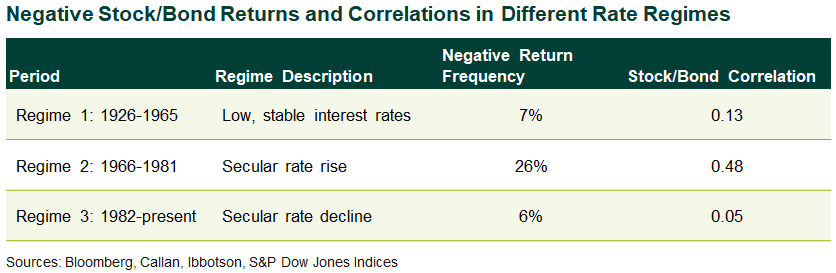
Index Definitions: for stocks, we use what we call the “Ibbotson S&P 500” index, in which we splice the S&P 500 index starting from 1972 with the Ibbotson Large Company stock index back to 1926. For bonds we use the “Ibbotson Aggregate,” in which we splice the Bloomberg Aggregate index starting in 1976 with a blend of 35% Ibbotson Corporate Long Term Bond index and 65% Ibbotson Intermediate Government index.
Regime Definitions: The Intermediate Government yield broke 5% for the first time ever in February 1966, so we started Regime 2 at the beginning of 1966. The Agg yield peaked at 16.50% at the end of 3Q81, so Regime 3 begins at the start of 1982.
Regimes 1 and 3 look very similar in terms of both frequency of negative quarters and stock/bond correlation (the two metrics are related but still interesting). In Regime 2 (rising inflation), the stock/bond correlation increases and bonds don’t provide nearly as much diversification benefit. The question today is whether we are entering another Regime 2!
While quarters with both stock and bond declines are not unusual, what is truly unprecedented is the depth of negative bond returns for this most recent four months covering January-April 2022. Looking at monthly data back to 1976, which is as far back as the Aggregate data go, the current four-month decline in bonds of 9.5% is the worst four-month return ever. The previous “record” was -8.5% through March 1980. The worst quarterly return was even lower than that, -8.7% also ending March 1980, so December 1979 was actually positive in that rolling 4-month calculation. Surprisingly, the worst calendar year return was just -3.3% in 1969. Even with that terrible first quarter, the return for calendar 1980 was +2.7%, so there’s hope for 2022!
The big difference between 1980 (and most of the index’s history) and now is the underlying yield. The price changes in 1980 were even greater than now as interest rates were hiked into double digits, but the underlying yield on the bonds helped cushion the return blow. The yield to worst on the Aggregate at the end of April was 3.48%, on a steady climb up from 1.75% at the start of 2022. In comparison, the yield to worst in March 1980 was 14.1%(!), providing an incredible cushion for capital losses due to interest rate hikes. We have no such cushion today, as we embark on a rising rate path starting from a protracted period of zero interest rate policy.
Did diversification fail in the first four months of 2022? The history of quarterly stock and bond returns falling together about 10% of the time suggests this experience is to be expected over the course of the capital markets cycle. For any investor who chose to de-risk during 2021 by reducing equity and increasing fixed income, a simple but broadly powerful method to reduce risk, the returns were essentially the same as if they had made no such move. Shouldn’t a low correlation between stocks and bonds lead to guaranteed protection from a stock market decline by holding bonds? Perhaps we can call it the curse of zero correlation. In the dark days for a market drawdown, what investors really want is correlation close to negative one, which indicates that when one asset class is down, the probability that the other asset class is up will be very high. What’s available in real life is a correlation closer to zero, which in statistics means there’s no discernable pattern between the returns of the two asset classes. Zero correlation indicates that when one asset class is down, the probability that the other asset class is up is actually very similar to the probability that it will be down!
During the onset of COVID in 2020, we saw a similar story play out with alternative risk premia (ARP) strategies. Stocks were down, but so were the ARP strategies. Then stocks recovered, but ARP did not. Now stocks are down this year, but several of the large ARP players are enjoying strong returns; one of the largest manager’s mutual funds is up 23.8% year-to-date following a 24.8% gain in 2021.
In normal times, a correlation close to zero suggests a very strong diversification benefit between two asset classes. But it doesn’t suggest that one will always move in the opposite direction of the other. Correlation is a slippery topic for many investors to understand. By definition, you need 12 periods minimum to calculate correlation (days, months, quarters), and so the more data one gets to generate a “better” estimate, the more likely you are to smooth out extreme events where correlations go to 1 for a very short period of time, the one thing you thought low correlation was helping to fight.
So you will hate your decision to diversify, but only half of the time. We at Callan believe in diversification, but remind ourselves that a diversified portfolio can still suffer losses in a number of asset classes at the same time, with the expectation that this phenomenon doesn’t happen 90% of the time. Diversification is not the same as explicit hedging, a topic for a future blog post.