When advising our sons and daughters on how to invest for their retirement in roughly 60 years, we point them to stocks and the budding venture capital ideas of their classmates. The same advice might also hold true for perpetual institutions with a nearly infinite time horizon, no annual cash-flow requirements, and a passing interest in market volatility.
But for most foundations, endowments, and other long-term pools of capital, cash-flow requirements are real and asset volatility is a concern. That means they have to seek sources of diversification, principal protection, and liquidity. Historically, investment-grade (IG) bonds have served those roles.
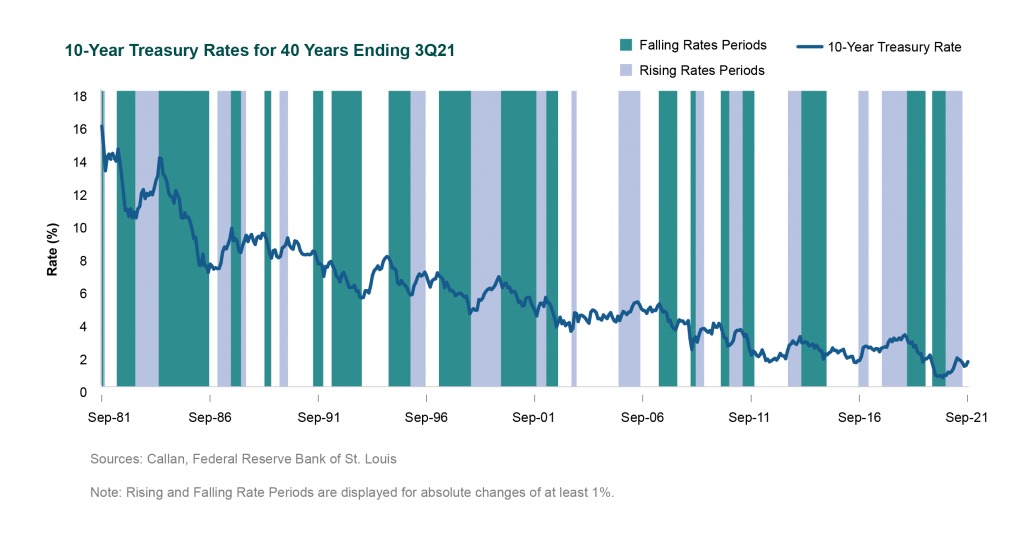
Our current market environment is the result of interest rates falling for over 40 years. Of course there have been periods in which rates have risen, but the trend is clear. This leads many market participants to question if we are approaching—or even at—the lower limit from which rates will rise. Others take this a step further and suggest that the combination of current low and future rising rates makes fixed income altogether unattractive.
Basic bond math holds that when interest rates go up, bond prices fall. So why the heck should investors own bonds in today’s market environment? Breaking down a bond’s total return into its basic components can be informative:
Bond Total Return ≈ Yield + Price Return + Other Return
Historically, Yield (used as a vernacular replacement for the more technically correct Coupon Return) has served as the primary driver of Total Return. Price Return, which is directly impacted by changes in interest rates, generally only contributes risk. This is the reason we call bonds “Fixed Income.” I lend you $100, you pay me an annual fixed yield for the privilege of borrowing my money, and at maturity you return my $100.
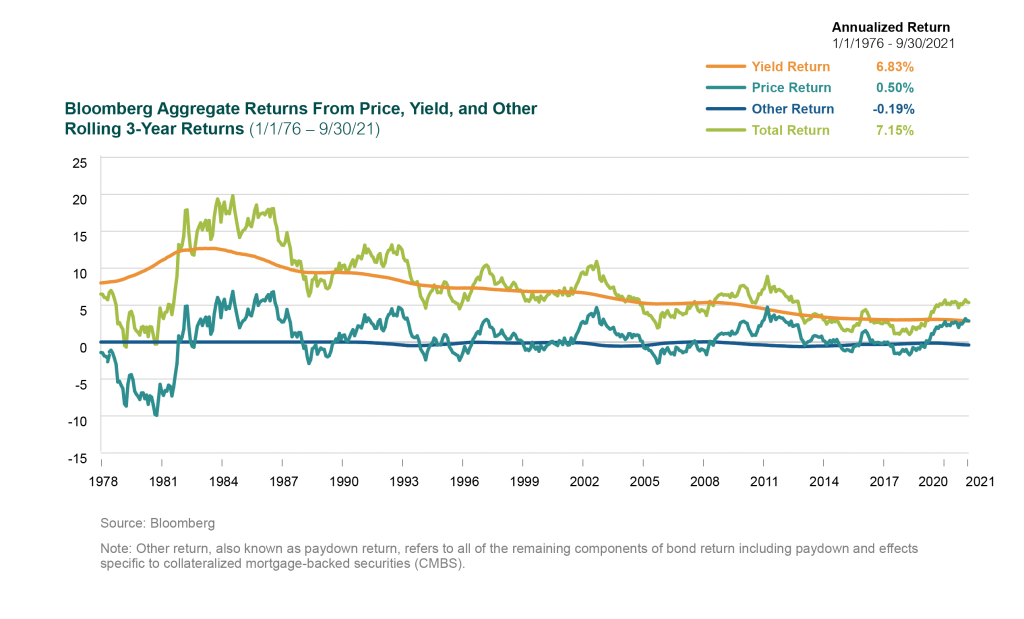
In the chart below, the total return of IG bonds and their return components are plotted quarterly on a rolling three-year basis going back to the mid-1970s. IG bond returns have been positive in 99% of the observations. Looking closer at the annualized results for each of the return components, some quick cocktail napkin math reveals that 96% of IG bond returns come from Yield while only 7% comes from Price Return (or sensitivity to interest rate movements), and the balance of -3% from Other Return. The conclusion: Keep your eye on the Yield.
So, if Yield is my return expectation and market yields are really low, then am I getting appropriately paid to take on Price Return volatility?
Truth be told, today’s market yields are not going to make you King Midas, and as interest rates rise, IG bond prices are expected to fall. In fact, today’s low starting yield of ~2.5% and concomitant high duration of ~6.7 increases the probability of a near-term negative total return beyond what we have seen historically. In other words, the current yield cushion is historically small relative to the amount of price risk taken. But mitigating some of that price risk is the reality that lower-yielding bonds can be reinvested at higher rates as they mature. Assuming you stay invested, capital losses from rising rates early in an investment horizon are more than offset by higher yields as the investment horizon progresses, and the long-term total return remains positive.
On the other hand, for growth-oriented investments like stocks and private equity, interest rates are just one of several macroeconomic influences that wax and wane in their impact on total return. As a result, equity owners are subject to much greater valuation volatility as their returns are more attributable to idiosyncratic risks, or company-specific operational and financial uncertainties. This difference in economic influences on the returns of IG bonds and stocks helps explain why they diversify one another so well. In the chart below, the range of three-year return outcomes between IG bonds and stocks is displayed from January 1926 to September 2021.
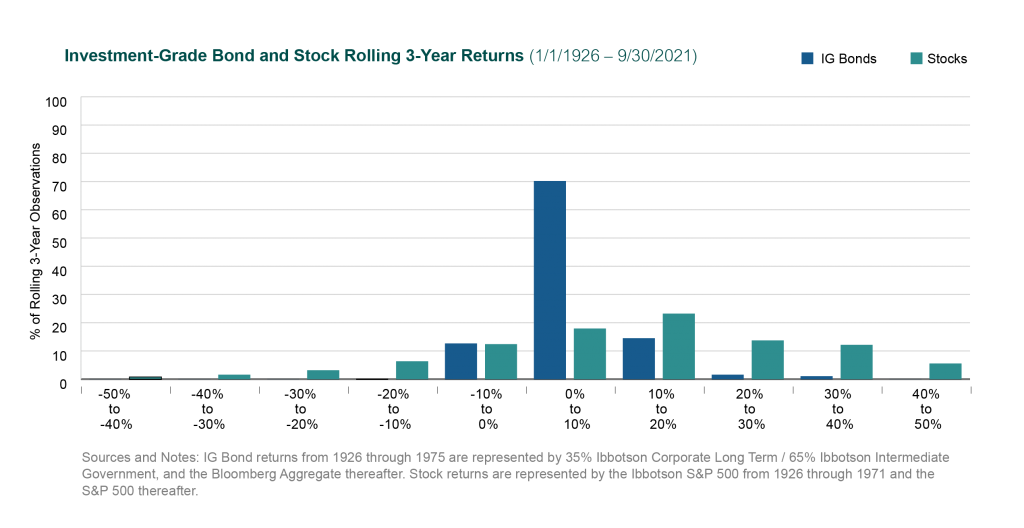
Taking nearly a century of quarterly return data, the range of three-year annualized return outcomes for stocks spans -42% to 43% while the range of outcomes for IG bonds is relatively tight, residing between -1% to 20%. The narrow return distribution and dramatic positive skew in rolling three-year IG bond returns highlights their role in downside risk mitigation and principal protection. Even if we assume a scenario where IG bond / stock correlations rise dramatically, a -1% three-year return outcome for IG bonds with regular coupon cash flow is vastly different than a -42% three-year return outcome for stocks. Taken in the context of a portfolio with regular cash outflows, the impact on the corpus could be material.
Each institutional investor must decide which risk / return trade-offs are attractive. For investors that have the trifecta of a high level of flexibility in cash outflow timing, an ability to play the long-game, and a cast-iron stomach for market risk, reducing or even eliminating IG bonds might be reasonable.
Most investors, however, do not fit this profile as they need some combination of cash flow, diversification, principal protection, and liquidity. For that crowd, we generally counsel holding a dedicated allocation to IG bonds. IG bonds spin off yield and participate in rising rate markets through principal reinvestment, and their return distribution provides downside protection that counter-balances growth-oriented portfolio investments. Despite frustratingly low expected returns, IG bonds can still contribute meaningfully to the long-term investment goals of most institutional investors.