Institutional investors have long heard that active fixed income managers strategically overweight credit risk to outperform their benchmarks. But this is only half the truth. Active managers have also rotated their portfolios across sectors of the fixed income market to adjust credit risk up or down at what they believe to be opportune times.
Could investors take a do-it-yourself (DIY) approach to strategic sector allocations and forego sector rotation within fixed income and still achieve results comparable to active managers? This approach is popularly known as “Disaggregating the Aggregate” when applied to fixed income portfolios benchmarked to the Bloomberg US Aggregate Bond Index, but it could be applied to any multi-sector index.
To help answer this question, in our white paper available at the link above, we used benchmark indices and risk-adjusted them to disentangle an active manager’s contribution to performance from a strategic overweight to credit vs. the contribution added by true sector rotation. This provides a quantitative framework for evaluating potential performance, which can be balanced against other considerations, including fees and expenses, complexity, and desired risk and performance patterns.
Analyzing Core Plus Fixed Income Managers
In this blog post, we highlight our analysis of the average returns of the Callan Core Plus Peer Group, representing active managers in this strategy, which indicates that active fixed income managers outperformed their respective benchmark index due to sector rotation above and beyond what could have been achieved with a strategic overweight to credit risk. What is also striking is that very similar results can be replicated in different arenas of fixed income, as we detail in our white paper.
If an asset owner had taken a DIY approach to strategic (i.e., static) sector allocation across investment grade and high yield bonds, how would it have stacked up against active core plus fixed income managers that have the ability to rotate between investment grade and high yield bonds across time? While active manager selection could add or detract from performance, the average return of the Callan Core Plus Peer Group is useful to illustrate a framework for answering this question and indicates the general level of attractiveness of manager selection for institutional investors deciding where to deploy active management instead of passive management across different asset classes. This implicitly assumes that an equal-weighted portfolio of all strategies in the peer group is rebalanced quarterly.
To appropriately risk-adjust the benchmark, we assumed institutional investors are interested in a DIY approach meeting these criteria:
- Fully invested, meaning there is no cash drag in the portfolio
- Long-only, meaning no short positions that benefit from declining bond prices
- No derivatives, which adds operational complexity that may be inappropriate for some
- No leverage
The DIY approach seeks a strategic allocation between two building blocks. The first is investment grade bonds, represented by the Bloomberg US Aggregate Bond Index. The second is high yield bonds, represented by the average return of the Callan High Yield Peer Group of actively managed strategies. The Aggregate was chosen as a proxy for the gross-of-fee returns of a passively managed strategy that would reduce fees relative to those paid to an active core plus fixed income manager. Actively managed high yield strategies were chosen because the focus of this analysis is to identify value added by core plus managers from sector rotation, not security selection within the high yield corporate bond sector.
The DIY strategic allocation was found by allocating to the two building blocks in the amounts that produced the smallest tracking error to the average return of the Core Plus Peer Group. Tracking error is defined as the volatility of the return difference between two portfolios, so minimizing this metric seeks to identify the DIY Core Plus Portfolio with the most similar long-term performance pattern possible when compared to active core plus strategies. Quarterly returns from 1Q97 to 4Q21 were used, annualized tracking error was calculated to the nearest 0.01%, and allocations were tested in 1% increments with a greater allocation given to high yield bonds if the tracking error of tested portfolios was similar within a rounding error.
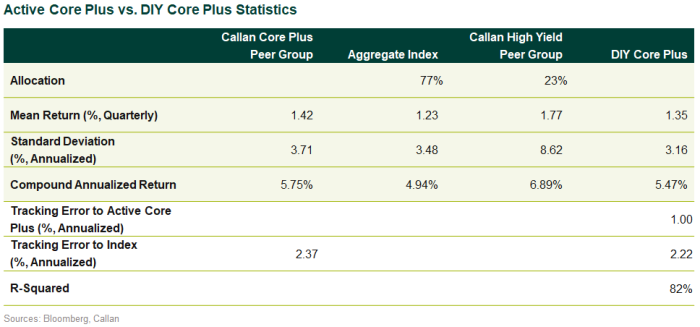
The DIY Core Plus Portfolio, a risk-adjusted benchmark, was composed of a 77% allocation to investment grade bonds and a 23% allocation to high yield bonds to achieve an annualized tracking error of 1.00%. The statistical results of the Core Plus Peer Group are compared to this DIY Core Plus Portfolio in this table.

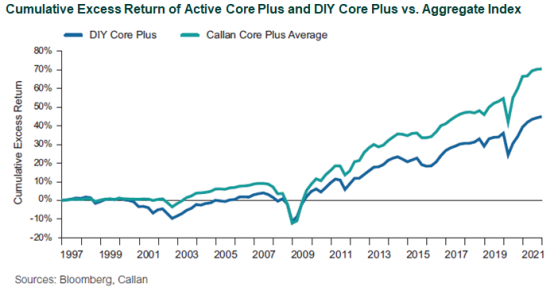
The cumulative excess returns of the Core Plus Peer Group and the DIY Core Plus Portfolio over the Bloomberg Aggregate are shown in green and blue, respectively, in the chart below. The risk-adjusted benchmark outperformed the index cumulatively by 44.94% over the time period shown, indicating that it was indeed more difficult to beat than the broad market index. Nevertheless, the Core Plus Peer Group outperformed by even more, 70.49% cumulatively. The performance pattern indicates that the bulk of outperformance occurred around periods of market stress, namely the bursting of the Dot-Com Bubble in 2000-01, the recovery from the Global Financial Crisis after 2008, and the outbreak of the COVID-19 pandemic in 2020.

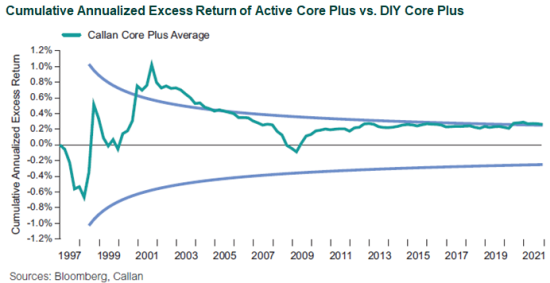
The cumulative annualized excess return of the Core Plus Peer Group over the DIY Core Plus Portfolio is shown in green in the next chart. Light blue lines show the 10th to 90th percentile confidence interval assuming constant tracking error to the DIY Core Plus Portfolio of 1.00%. At the end of the sample, the Core Plus Peer Group outperformed the DIY Core Plus Portfolio by 0.28% annualized and appears above the top light blue line, indicating that the outperformance vs. the risk-adjusted benchmark is statistically significant at the 10% level. In other words, the probability of this level of outperformance due to chance instead of manager skill, after assuming the risk-adjusted benchmark was correctly specified, is less than 10%.

The gross-of-fee results shown above should be considered alongside fees. Estimates of fees vary inversely with mandate sizes. Assuming a $150 million mandate size as an example, Callan estimates fees of 22 basis points on an active core plus mandate. A $150 million fixed income allocation split across the passive Aggregate index (77%) and active high yield mandates (23%) is estimated to blend to a total fee of 14 bps. So at the assumed fixed income allocation size, the DIY Core Plus approach results in estimated fee savings of approximately 8 bps. These fee estimates are based on fee quotes for recent searches conducted by Callan for institutional clients.
With this analysis, there is evidence that the average active fixed income manager has added value with sector rotation. This added value can be identified by measuring performance relative to risk-adjusted benchmarks that institutional investors might reasonably seek to mimic in practice when designing fixed income structures. While construction of risk-adjusted benchmarks confirmed that active managers do take more credit risk than market-based benchmarks, the average active manager still added incremental returns over the long term for reasonable levels of risk. This outperformance tended to be more concentrated around periods of market crises, which could indicate that some environments may be more attractive for active management than others. The ability to replicate this result across peer groups of actively managed core plus strategies strengthens the evidence that institutional investors could pursue additional returns by hiring active managers.
The evidence that active fixed income managers add value with sector rotation is consistent with Callan’s bottom-up analysis of individual managers. This experience also indicates that it is much more difficult for active managers to consistently add value through duration positioning or timing when interest rates will rise and fall.
While fee savings and the performance pattern of a DIY approach should be taken into consideration, the long-term hurdles to constructing a compelling structure this way could be substantial. Traditional active fixed income allocations that allow for sector rotation may be suitable for many institutional investors.

