Listen to This Blog Post
Our 2026 Defined Contribution Trends Survey explores the key tenets of DC plan management such as governance, investments, fees, plan design, and more. The insights distilled in the 19th annual edition of our survey provide a benchmark for sponsors to evaluate their plans compared to peers, and to offer actionable information to help them improve their plans and the outcomes for their participants.
This blog post summarizes highlights from the survey, conducted in late 2025. The survey incorporates responses from 80 mega DC plan sponsors, both Callan clients and other organizations. Respondents spanned a range of industries, with the top being government and financial services. More than 90% of plans in the survey had over $200 million in assets, and 62% had more than 10,000 participants. Sixty-one percent of respondents were corporate organizations, followed by public (21%) and tax-exempt (18%) entities.
Other Highlights from the 2026 DC Survey
Oversight
- Reviewing the investment policy statement (IPS) was the most prevalent fiduciary action taken in 2025, consistent with 2024. An IPS is a valuable governance tool that outlines the plan’s objectives and processes for selecting and monitoring funds based on the agreed-upon investment structure. While not legally required, it is highly recommended. Flexibility and regular updates ensure it remains practical and reflective of current committee practices. Completing formal fiduciary training for committee members and staff came in second (66%), representing a slight decrease from 2024 (73%).
- Plan governance and process returned as the top area of focus for DC plan sponsors in 2025, followed by investment management fees and investment structure evaluation. Effective governance of DC plans helps plan sponsors meet their fiduciary duties, abide by regulatory requirements, and minimizes the risk of litigation and negative press. Whatever the approach, the governance structure should address both investment and administrative responsibilities and activities in a way that promotes prudent decision-making and effective oversight without being overly complicated.
Investments
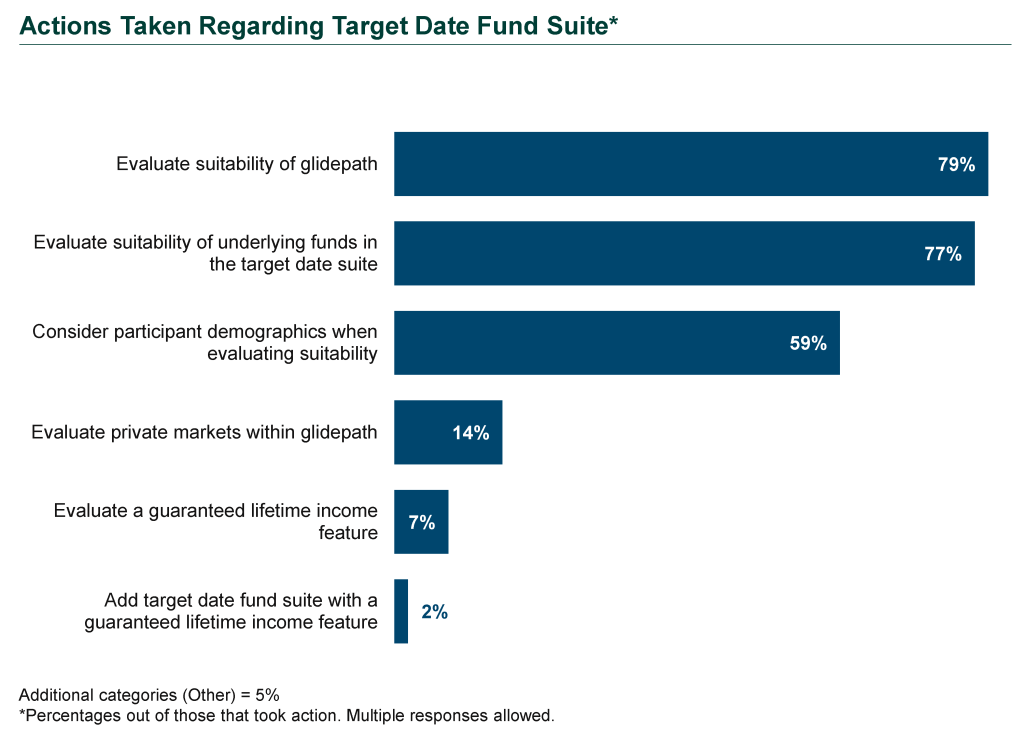
- More than three-quarters of respondents took at least one action around their target date fund (TDF) offering in 2025. The most common were to evaluate the suitability of the glidepath and the underlying funds based on their plan population.
- Some plan fiduciaries explored relatively new fund options, with 14% of respondents evaluating private markets as a glidepath component, and 7% considering a guaranteed lifetime income feature within a TDF structure. Only 2% began offering a target date series with a guaranteed lifetime income feature in 2025. For plan sponsors, education and tools to evaluate and compare different forms of guaranteed income will be increasingly important.
- In 2025, relatively few respondents reported they currently include or are considering alternative investments in their DC plans’ TDFs. Nearly one in five said their target date fund series currently has private markets exposure, primarily via private real estate.
- There was a slight decrease in DC plans offering an active/passive mirror versus those offering a mix of active and passive funds, after the prevalence of a mirror reached an all-time high of 50% the prior year. Most DC plans (95%) offered both active and passive investment funds.
- Mutual funds and collective investment trusts (CITs) continued to be the most prevalent investment vehicles, with mutual funds (83%) offered by more respondents than CITs (77%). Notably, certain plan types (e.g., 403(b) plans) remain ineligible to use CITs.
- 16% of respondents offered custom target date funds. Among those respondents, the most common reasons to do so were a desire to have best-in-class underlying funds and a better cost structure.
- 3 in 10 respondents offered white label funds in 2025, in line with the prior year. The most common asset classes for white label funds with multiple underlying managers were U.S. small/mid cap equity and non-U.S. equity.
Fees
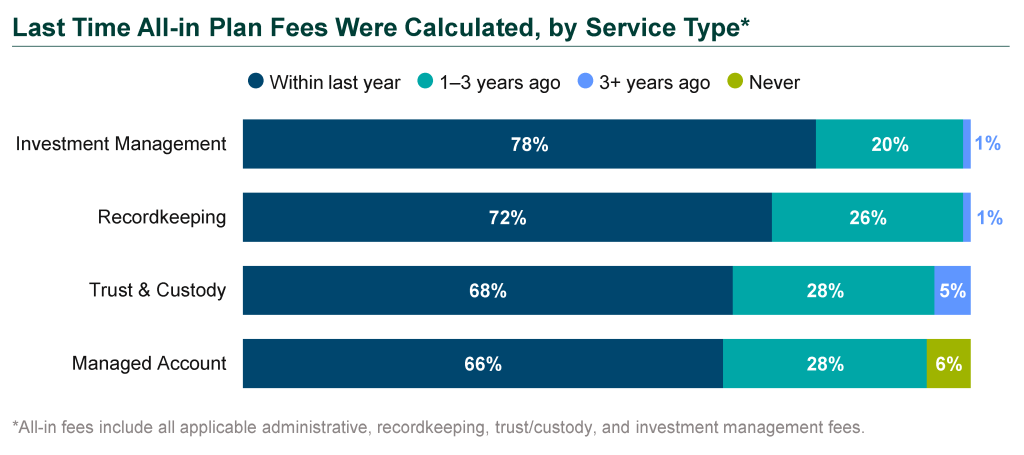
- The Employee Retirement Income Security Act (ERISA) requires plan fees to be reasonable. Sponsors must regularly review fees and compare them to market benchmarks to demonstrate prudence. About 7 in 10 plan sponsors calculated their recordkeeping fees within the past 12 months. Another 26% did so in the past one to three years. When calculating fees, 96% of those respondents also benchmarked fees, and more than 8 in 10 evaluated sources of indirect revenue (e.g., revenue shared with the recordkeeper from managed accounts, brokerage windows, IRA rollovers).
- 78% calculated investment management fees within the past 12 months—as a major target of litigation, reviewing investment management fees regularly is considered best practice.
- 65% of respondents said they evaluated the usage of forfeitures within the last year, with another 13% having done so within the last 1 to 3 years. While this is a best practice, beginning in late 2023 a flurry of lawsuits alleged that DC plan forfeitures were misused—by not following a prudent process to benefit participants, not following the terms of the plan document, or not using forfeitures in a timely manner. Documenting the practice and process for using forfeitures can be a valuable governance practice.
- Within the last year, 64% of respondents said they evaluated how float income, which is generated when assets are not invested (e.g., pending participant distributions), was handled within their DC plan. Notably, 21% of respondents had never evaluated the treatment of float income.
Advice Services
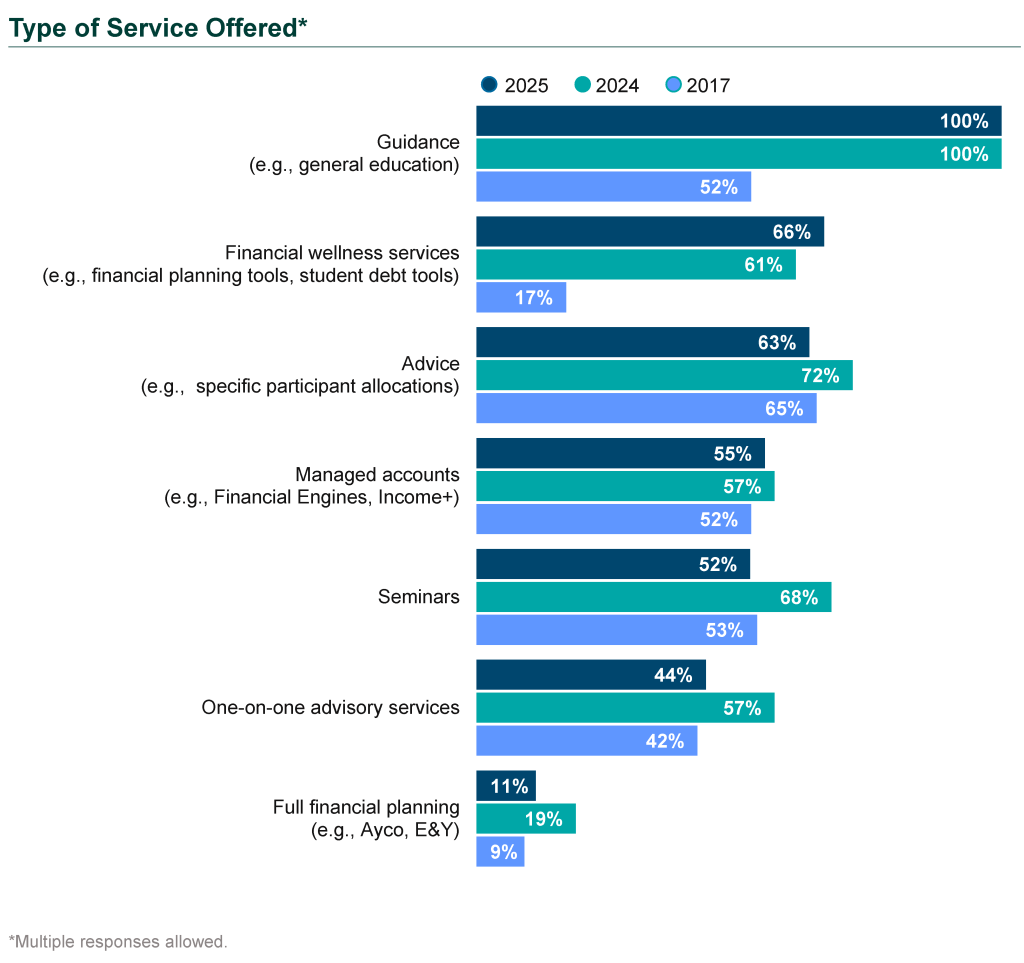
- All respondents offered some type of advisory service to participants.
- More than half of respondents offered a managed account service. Of those, 59% noted that their managed account provider actively solicited or campaigned to encourage participation in the service.
- Nearly three-quarters of respondents with managed accounts said they monitored or benchmarked the outcomes of the service. Among those that monitored, more than 90% reviewed participant usage and interaction, while more than 80% reviewed fees and services.
- Plans reported high levels of satisfaction with investment advisory services. Full financial planning received the highest overall marks, with all respondents very or somewhat satisfied.
- The service with the largest percentage of dissatisfied respondents was one-on-one advisory services, followed by managed accounts.
Roll-ins and Post-retirement Considerations
- Nearly 6 in 10 plan sponsors indicated that less than 10% of participants rolled in assets from their previous employers’ qualified plan.
- 36% of respondents had a strategy around retaining retiree and/or terminated participant assets. Of those, 86% sought to retain the assets of retirees, and 61% sought to retain the assets of terminated participants. Various rationales can drive the decision to retain assets. For example, retirees often have higher account balances, which can lead to cost efficiencies for the plan. On the other hand, account balances of employees who terminate before retirement can vary widely, as can the length of time before retirement, making these accounts potentially less efficient to retain.
- Most respondents offered some form of retirement income solution to employees in 2025. Installment payments (79%) and partial distributions (73%) remained the most common. Relatively few respondents reported offering solutions with a guaranteed income component.
SECURE 2.0 Act
- The most widely used optional SECURE 2.0 provision was increased catch-up contributions for participants aged 60 to 63 (90%). The next was self-certification of hardship withdrawals (66%).
- Nearly 60% of respondents have decided not to offer in-plan emergency savings accounts, but 34% have made emergency withdrawals available.
- Respondents indicated relatively little interest in allowing a match for those repaying student debt (16%) and in enabling automatic portability of safe harbor IRAs into the current employer’s plan (7%).
Please see our full survey for more detail and insights regarding these topics and extensive breakdowns of the data we gathered.
Along with the data in our quarterly Callan DC Index™ and Target Date Index™, this survey paints a detailed picture of the challenges and opportunities that are top of mind for DC plan sponsors.
Disclosures
The Callan Institute (the “Institute”) is, and will be, the sole owner and copyright holder of all material prepared or developed by the Institute. No party has the right to reproduce, revise, resell, disseminate externally, disseminate to any affiliate firms, or post on internal websites any part of any material prepared or developed by the Institute, without the Institute’s permission. Institute clients only have the right to utilize such material internally in their business.