You are currently viewing this website using the Internet Explorer (IE) web browser. This website has limited functionality in IE, and you won’t be able to download research documents. For an optimal experience, please access this website using any other supported web browser.
Listen to This Blog Post
Why does the S&P 500 have so much popularity when institutional investors, especially defined contribution (DC) plans, seem unwilling to give any love to the complementary version of the S&P small/mid cap index, the S&P 1000? In rejecting the S&P 1000, investors appear to believe that the S&P series is not “the market,” as S&P Dow Jones has a viability criteria that screens out non-earners from its primary indices.
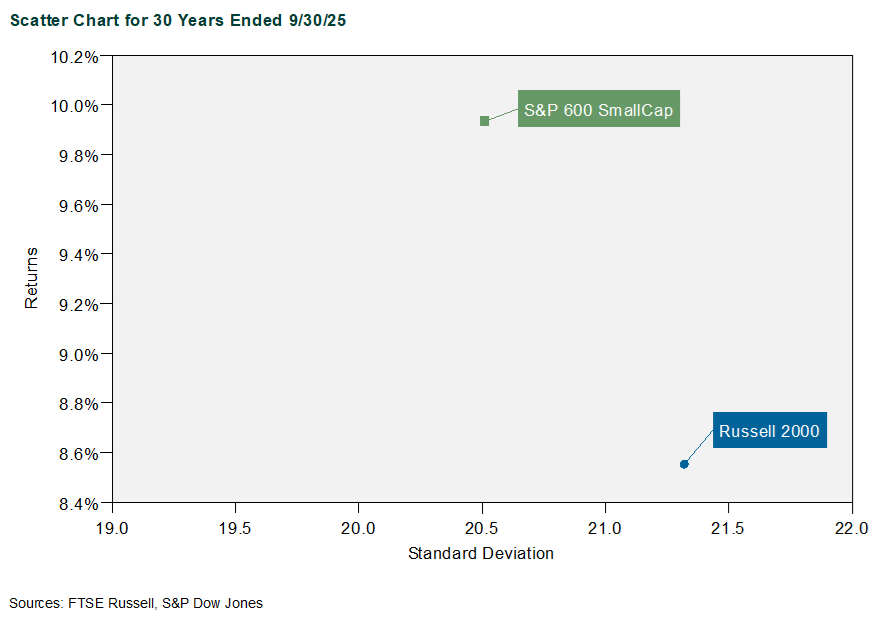
But aside from a quality tilt, the two indices combined are most of the market, and they do not have a material style or capitalization tilt in small/mid cap. Performance differences suggest that the viability criteria is far more meaningful in small cap than in large cap. Over a 30-year time frame, the S&P 600, which reflects small cap stocks, has outperformed the comparable FTSE Russell index, the Russell 2000, by around 1.5 percentage points per annum. That is not a misprint—1.5 points of excess return per year, with a lower standard deviation. There’s some nuance regarding that specific time frame and the reasons why, but I would argue that it has to do with the earnings criteria S&P employs that the Russell index does not.
As institutional investors know, the S&P 500 is mostly large/mega cap and contains fewer mid cap stocks than the Russell 1000. If institutional investors, especially defined contribution (DC) plans, were to pair the S&P 500 with either the S&P 600 or the Russell 2000 in the plan lineup, the plan would have a bias against some mid cap (relative to the Russell 3000). This is what probably led to the origin of the Russell 2500.
To complete the “full market” for the S&P series, the S&P Completion Index has everything in it except for the stocks that are in the S&P 500. This Completion Index includes essentially all the jetsam and flotsam that the S&P committee actively screens out and the companies that do not qualify for the S&P 500 based on size. I would argue that the S&P Completion Index is like Frankenstein’s monster and was never meant to escape the lab.
I would also argue that it is not optimal for use in active/passive mirrors for DC plans. When you have the S&P 500 as a starting point in large cap passive, as many DC plans do, why not use the S&P 1000? (The S&P 1000 is the S&P 600 and the S&P 400 (mid caps) put together.)
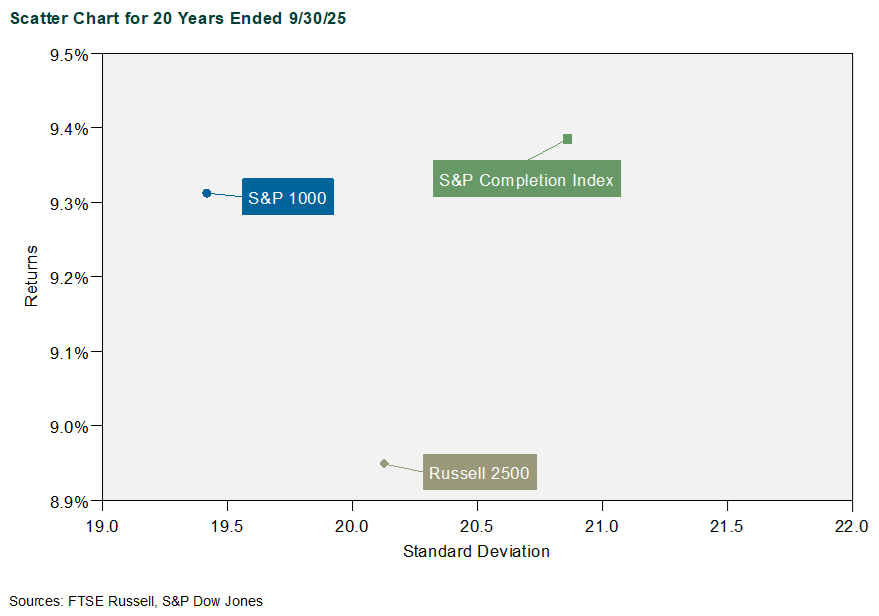
By measure of risk and return, the S&P 1000 is a superior index to the Russell 2500, and it is constructed to pair with the S&P 500. Relative to the Russell 2500, the S&P Completion Index has a meaningful size bias (it has almost 20 large cap stocks in it) and style biases (overweights to biotech). The S&P 1000 is better in all regards, save one … you would need to find a manager willing to create a product that tracks it. I have not yet found one.
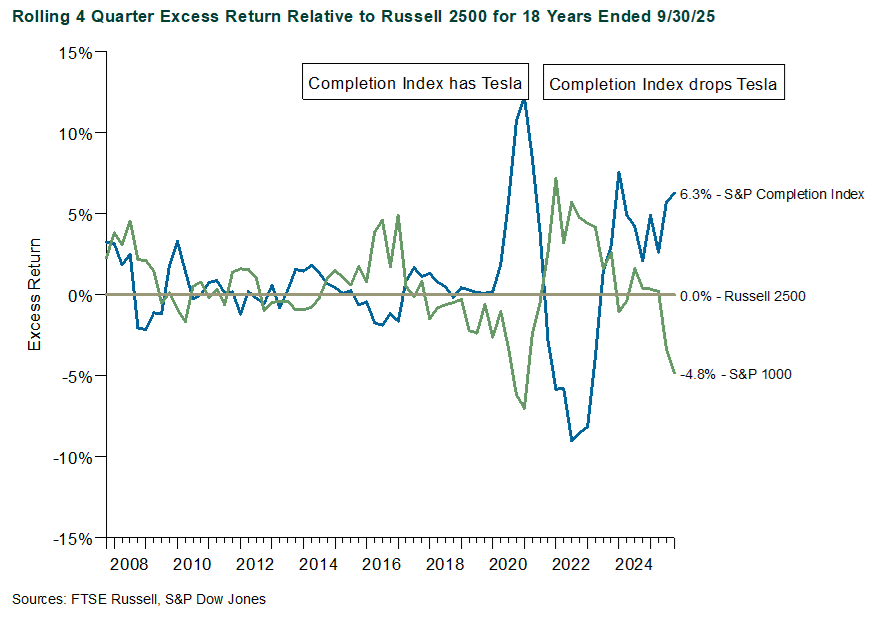
The interesting thing about the S&P Completion Index is that much of the performance advantage it gained over the Russell 2500 came from Tesla in the run-up to 2020. At that point it dropped out of the Russell 2500 and remained in the Completion Index. After then, the underperformance of the S&P Completion Index compared to the Russell 2500 was notable. More recently, the performance advantage of the S&P Completion Index and the Russell 2500 relative to the S&P 1000 is most likely driven by the capitalization difference (Completion is larger cap), and the frenzy around speculative digital asset treasury companies and yet-to-become profitable biotech and artificial intelligence names.
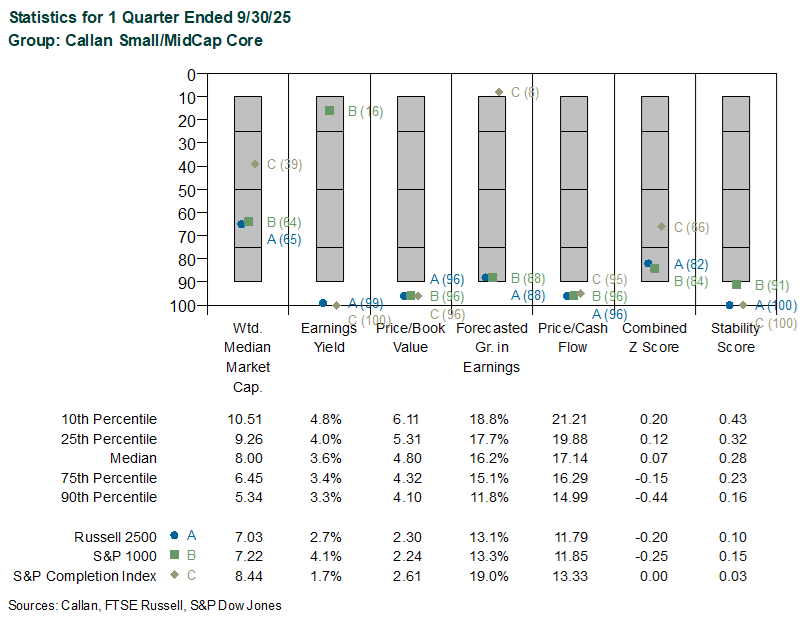
It is important to note that style and capitalization characteristics of the Russell 2500 and the S&P 1000 are not meaningfully different from one another, while the weighted median market cap of the S&P Completion index is over 20% greater than the Russell 2500. While the S&P Completion Index is closer to a Z-score of 0.0, the Z-score is materially more growth-oriented than the median active small/mid cap core manager in the Callan Small/Mid Cap Core Peer Group. The S&P Completion Index is also an outlier relative to the peer group as it relates to quality as measured by the stability score (i.e., it is the lowest quality of the three indices). This suggests that the S&P Completion Index has a higher percentage of companies with some combination of greater volatility characteristics, higher debt/equity, lower return on assets, and greater earnings variability.
After 15 years of near-zero Fed Funds Rates, it is reasonable to believe that the Russell 2000 index is the lowest quality it has ever been—i.e., it has the highest percentage of “zombie companies” and non-earners in its history. By extension, the same could be said about both the Russell 2500 and the S&P Completion Index. With this background, it appears prudent to give some thought to index quality before plan sponsors hand this option over to participants. Would DC participants really care that the small/mid cap index fund offered is not the “broad market”? If the starting point for large cap is the S&P 500, then the better small and mid cap index solution, the S&P 1000, may be hiding in plain sight. Now, if only an investment manager were listening …
Disclosures
The Callan Institute (the “Institute”) is, and will be, the sole owner and copyright holder of all material prepared or developed by the Institute. No party has the right to reproduce, revise, resell, disseminate externally, disseminate to any affiliate firms, or post on internal websites any part of any material prepared or developed by the Institute, without the Institute’s permission. Institute clients only have the right to utilize such material internally in their business.
For Investment Managers & Advisers
You are now leaving Callan LLC’s website and going to Callan Family Office’s website. Callan Family Office is not affiliated with Callan LLC. Callan LLC has licensed the Callan® trademark to Callan Family Office for use in providing investment advisory services to ultra-high net worth clients, family foundations, and endowments. Callan Family Office and Callan LLC are independent, unaffiliated investment advisory firms separately registered with the Securities and Exchange Commission under the Investment Advisers Act of 1940.
Callan LLC is not responsible for the services and content on Callan Family Office’s website. Inclusion of this link does not constitute or imply an endorsement, sponsorship, or recommendation by Callan LLC of their website, or its contents, and Callan LLC is not responsible or liable for your use of it. When visiting their website, you are subject to Callan Family Office’s terms of use and privacy policies.