Listen to This Blog Post
Callan’s 2025 Cost of Doing Business Study offers a comprehensive look at the investment management fees paid by institutional investors. Based on data from 180 asset pools totaling more than $772 billion in assets, this update captures fees paid in 2024 and extends trends tracked since 2010. The results show that while asset owners continue to find ways to lower fees within asset classes, shifts in asset allocation—especially toward alternatives—are pushing total fund costs higher for many.
Highlights from the 2025 Cost of Doing Business Study
This year’s study adds more detail on fund type and size:
- Nonprofits were broken out into two groups: over and under $1 billion.
- Corporate funds were broken out between total return and liability-driven plans and by size: over and under $1 billion.
- Public funds were broken out into three groups: over $10 billion, over $1 billion, and under $1 billion.
- Insurance pools were included for the first time.
Overall Fee Levels: Divergence by Investor Type
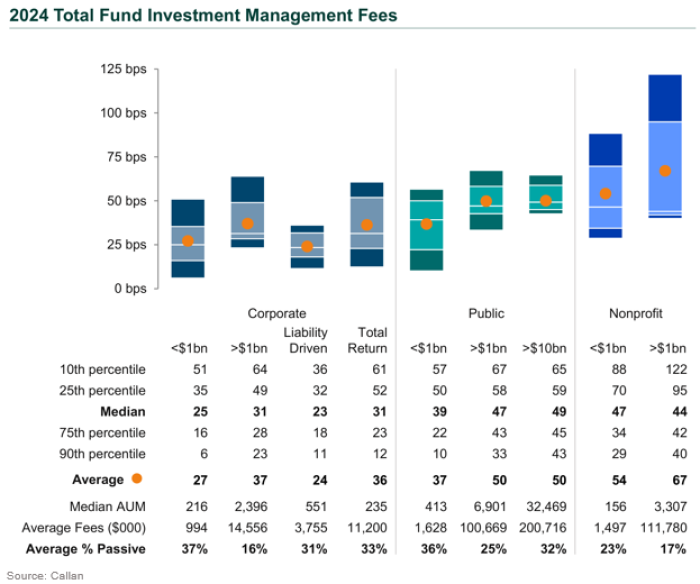
Total investment management fees averaged 40 basis points (bps) across all asset pools. But this headline figure masked significant variation across investor types:
- Nonprofits continued to pay the most, averaging 57 bps, driven by larger allocations to alternatives.
- Public funds averaged 43 bps, but the largest plans resembled nonprofits in both structure and fees.
- Corporate funds averaged 30 bps, driven by growing use of liability-driven investing (LDI).
- Insurance pools, with their conservative asset allocations, were the lowest at 20 bps.
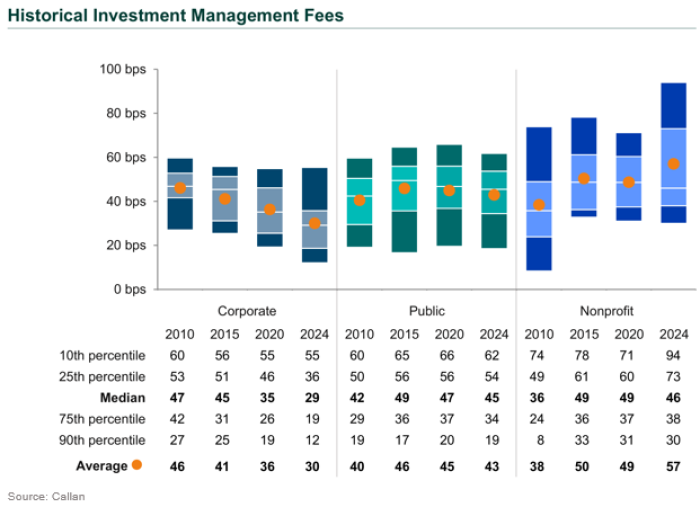
Notably, average fees for nonprofits have risen 16% since 2020, while corporate and public fund fees fell by 17% and 4%, respectively.
Fund Size and Structure Still Matter
Larger funds tended to pay more in total fees but also exhibited wider variation in fees:
- On average, large funds paid 24%–37% more in total fees than small ones, primarily because they allocate more to alternatives.
- Corporate LDI portfolios remained less expensive than corporate total return portfolios by roughly 50%.
- For public funds and nonprofits, scale did not always translate to lower fees due to more complex portfolios and higher allocations to alternatives.

While some cost savings were achieved through passive strategies and manager consolidation, these efforts were often outweighed by increased allocations to costlier asset classes.
Fee Trends Over Time: The Push-Pull of Allocation and Compression
Since 2010, active management fee compression has been a consistent theme, particularly in U.S. equity and fixed income. Yet total fund investment management fees have moved in different directions depending on the investor:
- Corporate funds reduced average fees by 35%, largely through LDI adoption and increased passive usage.
- Public funds saw fees rise before stabilizing.
- Nonprofits saw increases due to expanded alternatives exposure.

Within asset classes, fees have generally declined or flattened. U.S. equity fees, for instance, have converged in the 20–26 bps range across most fund types, a reflection of increased passive management—especially in large cap equities.
The Alternatives Effect
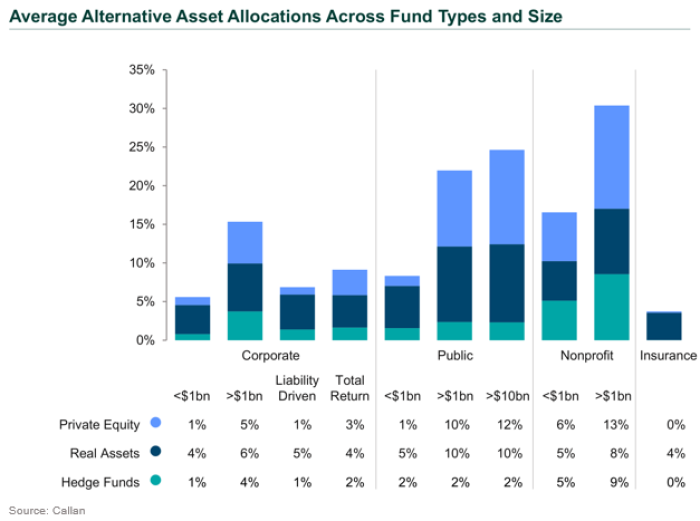
Asset allocation remained the single biggest driver of total fund fees. As more institutional investors shift toward private equity/private credit, real assets, and to a lesser extent hedge funds, they are accepting higher fees in exchange for potential diversification and return benefits. Consider the differences in alternatives allocations:
- Insurance pools: 4% on average
- Corporate funds: 8%
- Public funds: 15% (rising to 25% for the largest)
- Nonprofits: 19%, with some large plans exceeding 30%

Growing alternative allocations have been funded primarily from U.S. equity, where most passive usage growth has been. Perhaps the limits of total passive usage are being approached for many groups given passive has been less attractive in other asset classes.
Custody Fees and Operational Costs
Custody fees were also analyzed in this year’s study. These were modest—averaging under 1 bp for funds over $10 billion—but vary considerably with fund size and complexity. Notably:
- Funds under $500 million paid an average of 3.7 bps.
- Nearly one-fifth of the largest funds (>$10 billion) negotiated flat custody fee arrangements.
The study also notes that due to the high cost of technology development, including AI and distributed ledger applications, and compliance with new regulatory requirements, reductions in custody costs are unlikely in the near term despite long-term efficiency potential.
Final Thoughts
The 2025 study highlights a core tension in the institutional space: while fee compression continues within individual asset classes, broader structural shifts—especially toward alternatives—are lifting total fund costs. Institutional investors appear to be prioritizing portfolio objectives over fee minimization, especially as opportunities for further savings in passive and public markets strategies diminish.
With over $4.2 billion in annual fees represented in this year’s dataset, the study offers an important benchmark for asset owners evaluating the cost-effectiveness of their investment programs.
Mark Kinoshita of Callan’s Implementation Solutions Group contributed to this blog post and the study.
Disclosures
The Callan Institute (the “Institute”) is, and will be, the sole owner and copyright holder of all material prepared or developed by the Institute. No party has the right to reproduce, revise, resell, disseminate externally, disseminate to any affiliate firms, or post on internal websites any part of any material prepared or developed by the Institute, without the Institute’s permission. Institute clients only have the right to utilize such material internally in their business.

