
You are currently viewing this website using the Internet Explorer (IE) web browser. This website has limited functionality in IE, and you won’t be able to download research documents. For an optimal experience, please access this website using any other supported web browser.
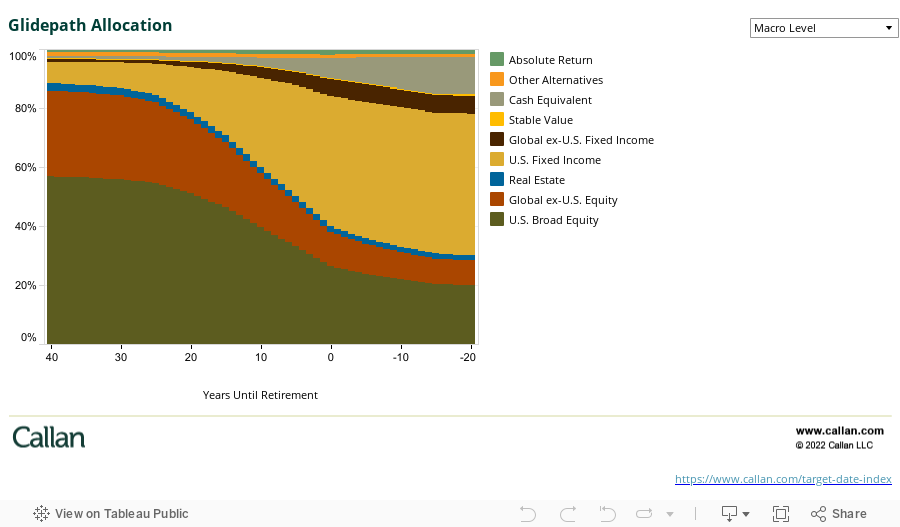
The Callan Target Date Index Asset Allocation chart provides insight into the underlying asset class composition of the Callan Target Date Index over the full asset allocation glidepath. Multiple views offer varying degrees of detail into asset allocation.
The Macro Level View depicts the allocation over the course of the Index’s glidepath (40 years before retirement and 20 years after retirement) across nine major asset classes.
The Micro Level Views show the allocation over the course of the Index’s glidepath broken out into much more granular asset classes with options to examine equity and fixed income asset classes separately.
Use the drop-down menu to the right to see the different views.
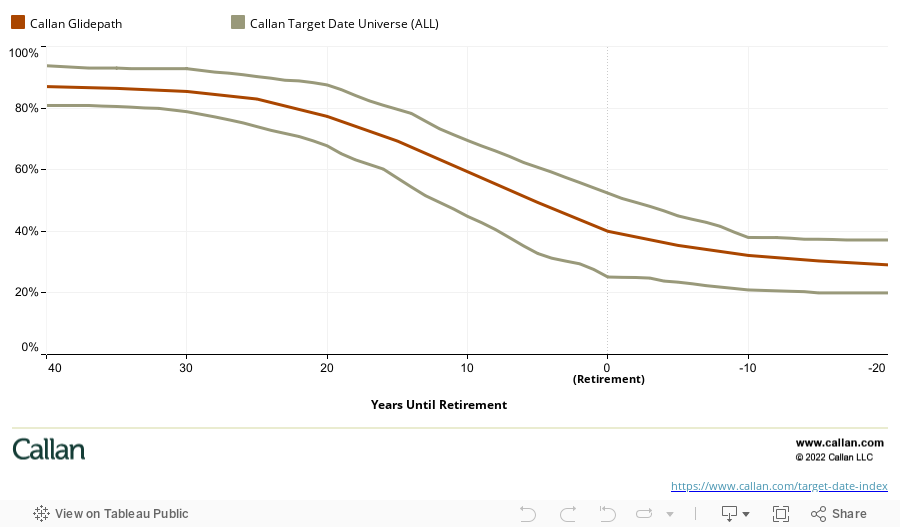
The Equity Rolldown Analysis chart displays the Callan Target Date Index’s equity allocation (excluding commodities and REITs) across the full asset allocation glidepath, including 40 years prior to and 20 years after retirement. The range in grey shows each target date vintage’s equity exposure at the 10th and 90th percentiles across the full glidepath.
Simply hover over the various lines in the chart to see the equity exposure for each vintage year.
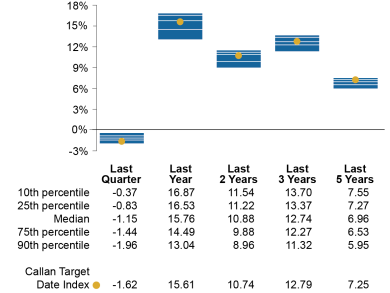
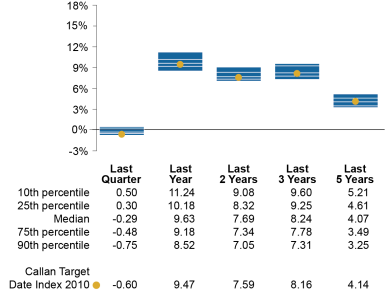
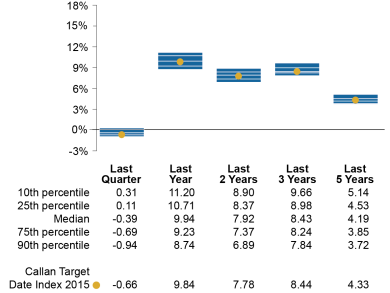
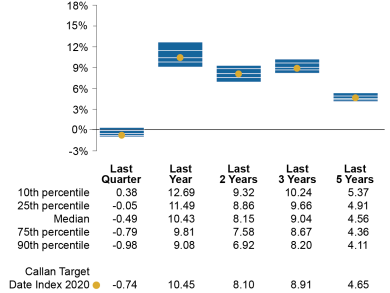
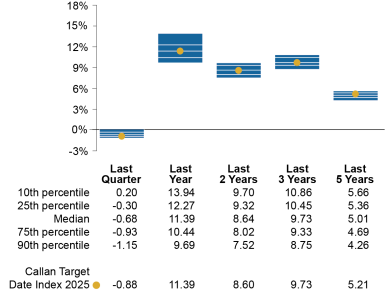
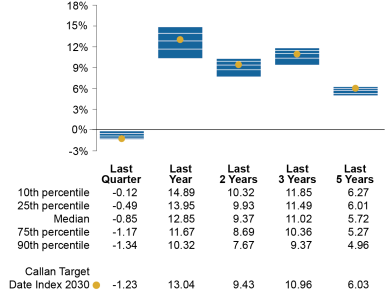
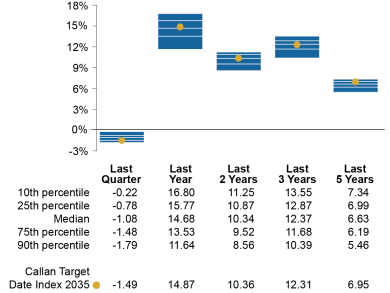
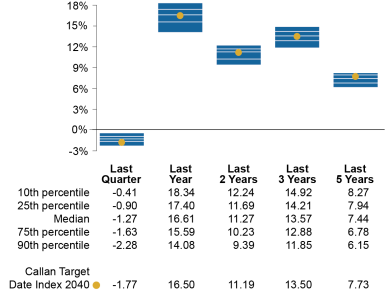
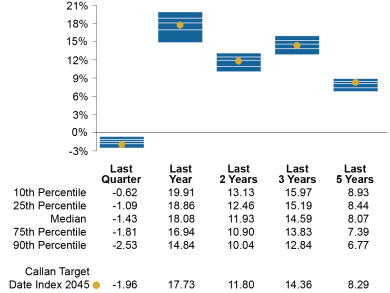
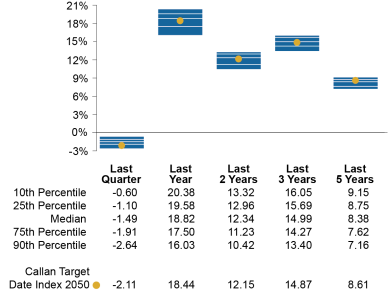
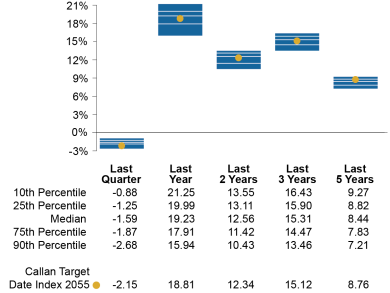
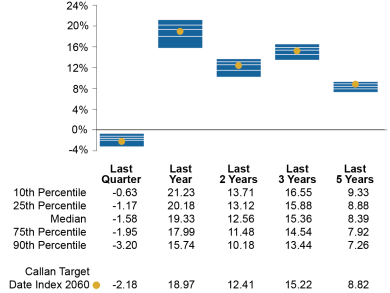
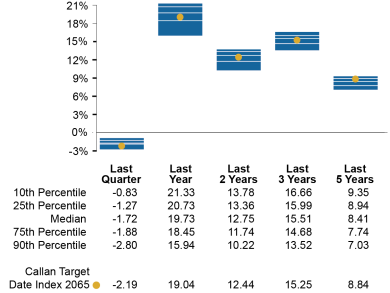
The Callan Target Date Index – Average of All Vintages chart gives a snapshot of the performance of the Callan Target Date Index. We show the aggregate performance of the universe of target date funds at a glance by equally weighting every “vintage” within the target date fund glidepath (e.g., 2015, 2020, 2025, etc.). The charts also show the range of performance of the Callan Target Date Index members, similarly weighted.
Click on the various vintage years to see the performance over time.
The Callan Target Date Index™ followed up a gain of 2.6% in 4Q25 with loss of 1.6% in 1Q26. The median target date fund (TDF) manager outperformed the Index by 47 basis points in the quarter, narrowing the gap in one-year returns (15.8% for the manager vs. 15.6% for the Index). The gap also narrowed for trailing five-year returns (7.0% for the manager vs. 7.3% for the Index).
1Q26 saw losses in U.S. equity and flat to slightly negative returns in U.S. fixed income markets. In the quarter, the 10th percentile manager fell 0.4% while the 90th percentile manager lost 2.0%. The one-year spread widened to 3.8 percentage points from the previous quarter’s 3.7 points.
The S&P 500 followed the previous quarter’s gain with a loss of 4.3% in 1Q26, while the Bloomberg US Aggregate Bond Index was essentially flat with a loss of 5 basis points. The median 2055 TDF manager lost 1.6% while the median 2025 TDF manager fell 0.7%. The median 2055 manager’s trailing one-year return (19.2%) is higher than the median 2025 manager’s return (11.4%), causing the one-year spread to widen to 7.8 percentage points from the previous quarter’s 7.0 points.
The Expense Ratio Analysis shows the distribution of expense ratios for funds within the Target Date Index. The group includes the lowest fee share class of mutual funds as well as collective trusts. For this universe, the median expense ratio is 35 basis points; the 10th percentile is 62 bps; the 90th percentile is 7 bps (i.e., the higher the fee, the lower the ranking). Much of the difference is driven by active versus passive implementation of target date glidepaths.
The Callan Target Date Index is an equally weighted composite of 64 target date fund series, including both mutual funds and collective trusts. It is updated quarterly. To accurately benchmark a target date fund it is essential to determine an appropriate target date fund index. Many current target date indices simulate capital markets and derive an artificial glidepath to create a suite of target date indices.
This approach could be labeled biased or subjective—or even worse, arbitrary—because it does not objectively represent the target date opportunity set. After all, if a given target date fund’s performance differs from such an index, what does that really signify that is meaningful from an evaluation perspective? To avoid this problem, Callan constructed a consensus glidepath that is driven by the actual glidepaths offered within the industry.
For Investment Managers & Advisers
You are now leaving Callan LLC’s website and going to Callan Family Office’s website. Callan Family Office is not affiliated with Callan LLC. Callan LLC has licensed the Callan® trademark to Callan Family Office for use in providing investment advisory services to ultra-high net worth clients, family foundations, and endowments. Callan Family Office and Callan LLC are independent, unaffiliated investment advisory firms separately registered with the Securities and Exchange Commission under the Investment Advisers Act of 1940.
Callan LLC is not responsible for the services and content on Callan Family Office’s website. Inclusion of this link does not constitute or imply an endorsement, sponsorship, or recommendation by Callan LLC of their website, or its contents, and Callan LLC is not responsible or liable for your use of it. When visiting their website, you are subject to Callan Family Office’s terms of use and privacy policies.