

You are currently viewing this website using the Internet Explorer (IE) web browser. This website has limited functionality in IE, and you won’t be able to download research documents. For an optimal experience, please access this website using any other supported web browser.
Twice a year, Callan takes a deep dive into asset flow data to extrapolate trends and identify the most successful investment managers in each asset class. What we found in our most recent analysis, for year-end 2017, is consistent with many of the broad challenges the institutional asset management industry is facing. However, this analysis did uncover some areas of opportunity for investment managers. Data described in this post are derived from Callan’s Style, Trend, Analysis, and Research (STAR) Report, a paid service offered by Callan’s Institutional Consulting Group. Accordingly, we must refrain from sharing the full data set, but are excited to describe some of the main themes that emerged from the analysis.
Callan’s STAR report separates assets into three buckets: U.S. tax-exempt separate account and commingled fund assets, institutional share classes of mutual funds, and retail share classes of mutual funds. Throughout this blog post, we will focus only on U.S. tax-exempt assets.
Active vs. Passive
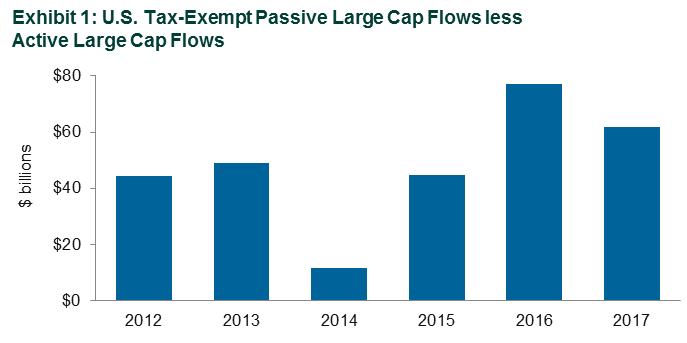
Any conversation on key trends in the investment industry would be incomplete without addressing the shift to passive management. However, measuring the success of passive management versus active management cannot be done by looking at the absolute level of inflows and outflows. Shifts in asset allocation and rebalancing efforts can create active management outflows, but they will also cause passive outflows. Therefore, it is better to look at the difference between active outflows and passive outflows. This is a reasonable estimate of the size of the flow to passive assets from active. Data in Exhibit 1 show that an average of $48 billion in U.S. tax-exempt separate account and commingled fund assets have flowed into passive large cap from active large cap annually since 2012.
However, as any asset manager is likely to tell you, this phenomenon is not limited to large cap. Since 2012, an average of $20 billion and $27 billion has moved from active to passive for U.S. small cap and non-U.S. equity, respectively.
The Natural Limits of Diversification
As Einstein famously postulated in 1905, even the speed of light has a limit. So it should follow that portfolio diversification also has a limit, and we are beginning to see that play out in asset flow data. In 2016, Jay Kloepfer and Julia Moriarty of Callan’s Capital Markets Research group co-authored a paper titled Risky Business, in which they looked at how portfolios have needed to become more complex over time in order to reach a 7.5% return (Exhibit 2).
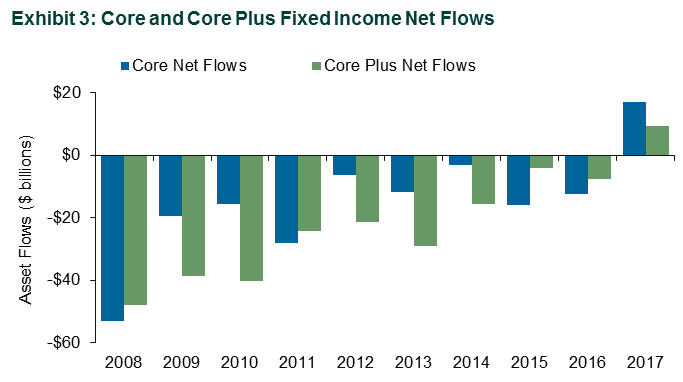
Yet, these increased allocations to asset classes such as non-U.S. equity, real estate, and private equity must come at the expense of other asset classes. One funding source for these increased allocations has been core and core plus fixed income. Callan’s STAR data shows that the degree to which these asset classes have been used as a funding source appears to be decreasing. As shown in Exhibit 3, these asset flows have slowly become less negative over the past decade and actually turned positive in 2017.
Callan did not see a lot of new assets being allocated to core and core plus during 2017, suggesting that money may have come into the asset classes due to rebalancing and that the natural limits of diversification have begun to stem the outflows from core and core plus.
Where Is the Money Going?
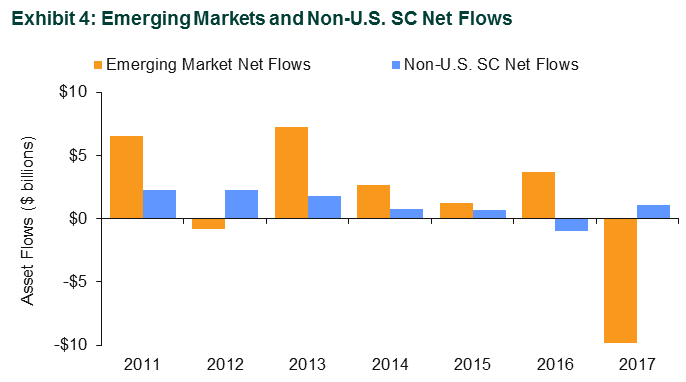
The STAR analysis tracks asset data at the investment strategy level. Therefore, when assets leave, we cannot see exactly where they go, but that does not prevent us from being able to make inferences. An understanding of industry trends is particularly useful in this exercise. For example, Callan works with many plan sponsors that have shifted their policy benchmark to the MSCI ACWI ex-USA IMI Index. A move from an EAFE index to an ACWI index will include the addition of emerging markets. Similarly, shifting from ACWI to ACWI IMI expands the universe to include non-U.S. small cap. Therefore, it stands to reason that both the emerging market equity and non-U.S. small cap asset classes would have experienced inflows over the past several years, and that is exactly what the data in Exhibit 4 shows.
Last year’s Callan data show outflows of U.S. tax-exempt assets from emerging market equity. However, it is helpful to keep in mind that this was a year during which the MSCI Emerging Markets Index returned 37.8%, likely causing rebalancing activity away from the asset class.
Why Is This important?
Asset flow data can be a valuable tool used to identify, validate, or question trends in the investment industry. Increasingly, investment managers are making important decisions about their future business strategies and fund sponsors are seeking to understand what their peers are doing in the face of low capital market return expectations. It is important to make sure these decisions are based upon a combination of quality data and a deep understanding of the qualitative factors shaping the investment landscape.
Callan’s proprietary STAR Report goes into extensive detail about all of these asset classes. If you are interested in more information, please feel free to contact Joan Dorow with Callan’s Institutional Consulting Group at [email protected].
For Investment Managers & Advisers
You are now leaving Callan LLC’s website and going to Callan Family Office’s website. Callan Family Office is not affiliated with Callan LLC. Callan LLC has licensed the Callan® trademark to Callan Family Office for use in providing investment advisory services to ultra-high net worth clients, family foundations, and endowments. Callan Family Office and Callan LLC are independent, unaffiliated investment advisory firms separately registered with the Securities and Exchange Commission under the Investment Advisers Act of 1940.
Callan LLC is not responsible for the services and content on Callan Family Office’s website. Inclusion of this link does not constitute or imply an endorsement, sponsorship, or recommendation by Callan LLC of their website, or its contents, and Callan LLC is not responsible or liable for your use of it. When visiting their website, you are subject to Callan Family Office’s terms of use and privacy policies.