You are currently viewing this website using the Internet Explorer (IE) web browser. This website has limited functionality in IE, and you won’t be able to download research documents. For an optimal experience, please access this website using any other supported web browser.
Listen to This Blog Post
U.S. stocks rallied in 2Q25, sharply recovering from volatility earlier in the year and fears of tariff escalation. Global ex-U.S. equities continued to outperform U.S. stocks in 2Q. Fixed income markets posted modest gains in 2Q as interest rates remained volatile. Liquid alternatives had mixed results in 2Q: Commodities and REITs fell while infrastructure and natural resources equities rose as investors sought inflation protection. Gold continued its stellar run.
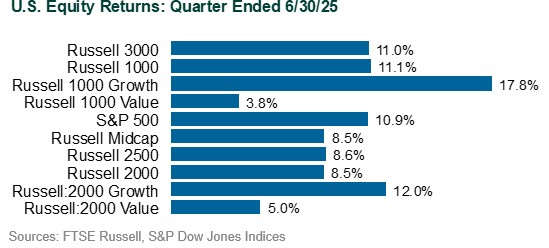
U.S. Equities: The S&P 500 gained 10.9% for the quarter (+6.2% YTD), fueled by trade tension de-escalation, robust 1Q earnings, and sustained enthusiasm for AI and tech-driven growth. Information Technology surged (+23.7%), followed by Communication Services (+18.5%). Consumer Discretionary (+11.5%) and Industrials (+12.9%) also posted solid gains underpinned by strong earnings. Health Care (–7.2%) lagged as policy uncertainty and reimbursement concerns weighed on sentiment, while energy (–8.6%) declined amid falling oil prices and fears of slowing demand.
Performance dispersion among the Magnificent Seven was notable, with several names (Nvidia, Microsoft, Meta, and Alphabet) contributing materially to the rebound. Style trends also shifted during the quarter: Growth stocks (Russell 3000 Growth: +17.6%) sharply outperformed Value (+3.8%), reversing 1Q’s defensive tilt. Small cap equities (Russell 2000: +8.5%) participated in the rally but remained in negative territory YTD (–1.8%).
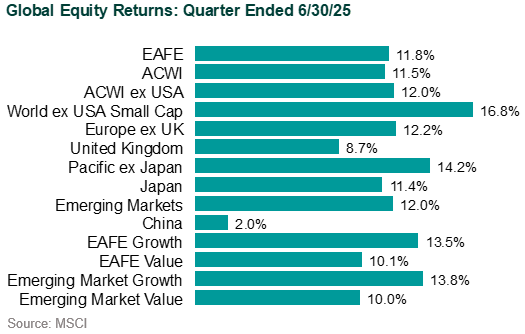
Global Equities: The MSCI ACWI ex-USA Index rose 12.0% (+17.9% YTD), with developed markets (MSCI EAFE: +11.8%) and emerging markets (MSCI EM: +12.0%) both advancing. European equities posted broad-based gains amid increased defense spending and supportive monetary policy. Some emerging markets saw a strong quarter as well, with Korea (+32.7%) and Taiwan (+26.1%) standing out amid renewed enthusiasm for semiconductor and technology supply chains. The sharp decline in the dollar (DXY down ~10% YTD) further supported global ex-U.S. returns in both local currency and USD terms.
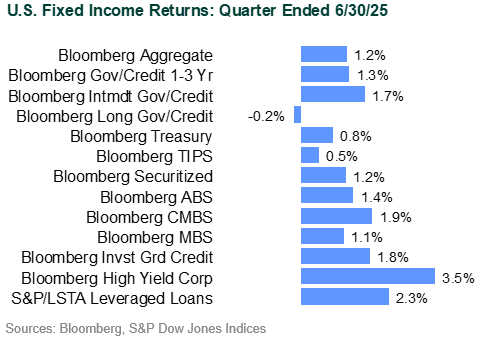
Fixed Income: The Bloomberg US Aggregate Bond Index rose 1.2% (+4.0% YTD), supported by safe-haven demand following the tariff-related shocks. The 10-year Treasury yield ended the quarter unchanged (4.24%) despite notable mid-quarter volatility, briefly spiking above 4.50%. TIPS were up 0.5% (+4.7% YTD), underperforming nominals as inflation breakeven rates drifted lower (the 10-year breakeven fell to 2.29% by quarter-end).
Investment grade corporate bonds outperformed Treasuries (Bloomberg Corporate: +1.8%) as spreads tightened modestly, supported by strong corporate balance sheets and robust demand for yield. High yield corporates (Bloomberg High Yield: +3.5%) outperformed investment grade, benefiting from the risk-on rally late in the quarter, and leveraged loans (S&P/LSTA Leveraged Loan Index: +2.3%) also saw renewed demand. Municipal bonds slipped further in 2Q (–0.1% QTD, –0.4% YTD), as supply pressures persisted following a weak first quarter and valuations cheapened relative to Treasuries.
Liquid Alternatives: Commodities (Bloomberg Commodity Index: –3.1%) declined as oil prices dropped sharply in April when OPEC+ ramped up its output; WTI crude underwent its worst monthly decline since 2021, reaching as low as $57 a barrel. REITs (FTSE Nareit: –1.2%) declined amid rising interest rates and economic uncertainty, while the S&P Global Listed Infrastructure and S&P DJ Brookfield Natural Resource Equities indices rose 4.5% and 3.4%, respectively, as investors sought inflation protection. Gold prices continued their strong performance, reflecting persistent macro uncertainty and ongoing hedging demand. Meanwhile, defensive equity strategies lagged, with the MSCI USA Minimum Volatility Index rising just +0.5% as investors rotated into higher-beta, growth-oriented sectors.
Disclosures
The Callan Institute (the “Institute”) is, and will be, the sole owner and copyright holder of all material prepared or developed by the Institute. No party has the right to reproduce, revise, resell, disseminate externally, disseminate to any affiliate firms, or post on internal websites any part of any material prepared or developed by the Institute, without the Institute’s permission. Institute clients only have the right to utilize such material internally in their business.
For Investment Managers & Advisers
You are now leaving Callan LLC’s website and going to Callan Family Office’s website. Callan Family Office is not affiliated with Callan LLC. Callan LLC has licensed the Callan® trademark to Callan Family Office for use in providing investment advisory services to ultra-high net worth clients, family foundations, and endowments. Callan Family Office and Callan LLC are independent, unaffiliated investment advisory firms separately registered with the Securities and Exchange Commission under the Investment Advisers Act of 1940.
Callan LLC is not responsible for the services and content on Callan Family Office’s website. Inclusion of this link does not constitute or imply an endorsement, sponsorship, or recommendation by Callan LLC of their website, or its contents, and Callan LLC is not responsible or liable for your use of it. When visiting their website, you are subject to Callan Family Office’s terms of use and privacy policies.