You are currently viewing this website using the Internet Explorer (IE) web browser. This website has limited functionality in IE, and you won’t be able to download research documents. For an optimal experience, please access this website using any other supported web browser.
As inflation pounces on the U.S., institutional investors need to understand how various asset classes have responded to rising inflation in the past. In this blog post, we will tackle the effect of inflation on public U.S. equities, which does not get a lot of attention because investors generally assume that equities over the long term will have a higher return than inflation.
But is that true? The good news is that the answer is yes. While some short-term inflationary market environments have produced negative equity returns, stocks have hedged inflation and had positive real returns over longer periods.
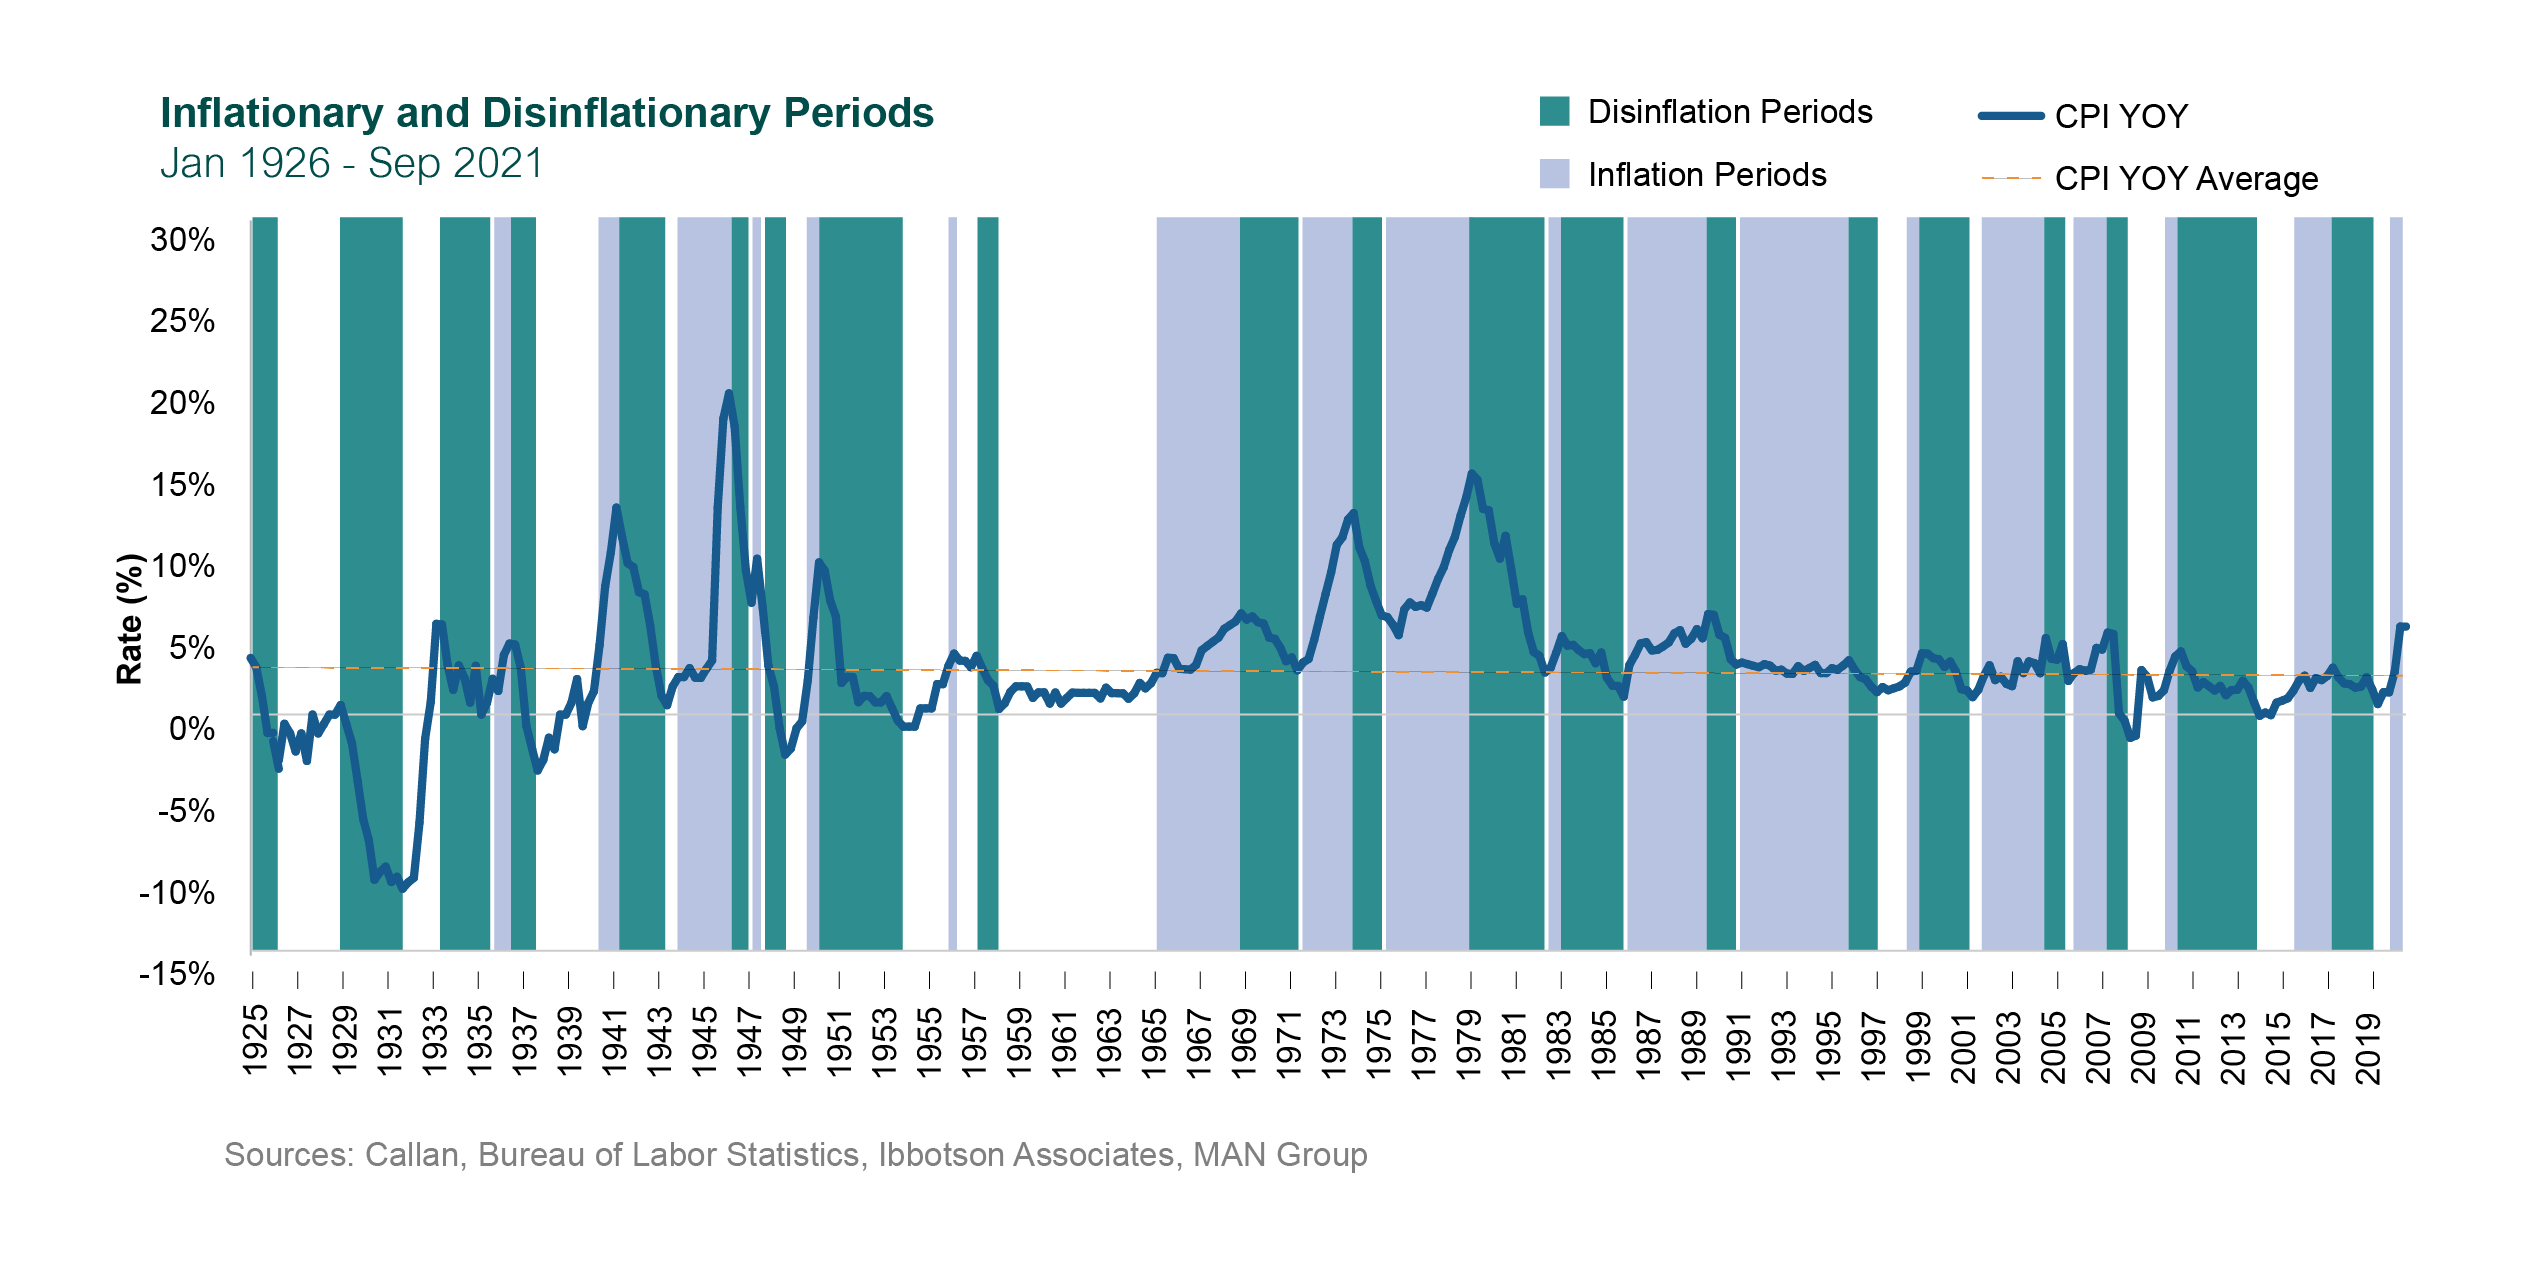
We dug further and studied the relationship between public U.S. equities and the Consumer Price Index (CPI) going back several decades. First, we defined inflationary periods using the following methodology (inspired by the work of Ben Funnel et al. in “The Best Strategies for Inflationary Times”):
For equities, we used Ibbotson data on large cap and small cap stocks going back to 1926. The methodology identified 18 inflationary periods and 20 disinflationary periods. Average YOY inflation was 3.0%.
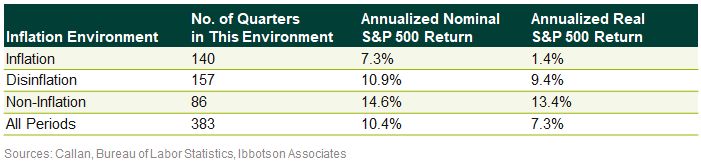
Next, we calculated the annualized return of U.S. large cap equities across all of the quarters previously identified as inflationary, disinflationary, or neither. The data reveal that large cap equities prefer the low and stable inflation of non-inflation periods over any other environment. It is also clear that inflationary environments are the least favorable for equities, especially in real terms. However, the nominal returns are still strong in these periods, with an annualized gain of almost 7.3%.
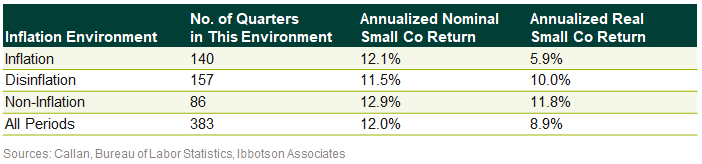
We ran a parallel analysis for U.S. small cap stocks. Compared to large caps, the nominal returns of small cap stocks in inflationary vs. disinflationary environments are not as stark, but small cap still had the best overall performance in non-inflation periods. In real terms, however, the results are very similar to large cap, with inflationary periods generating the lowest returns for small cap by a wide margin.
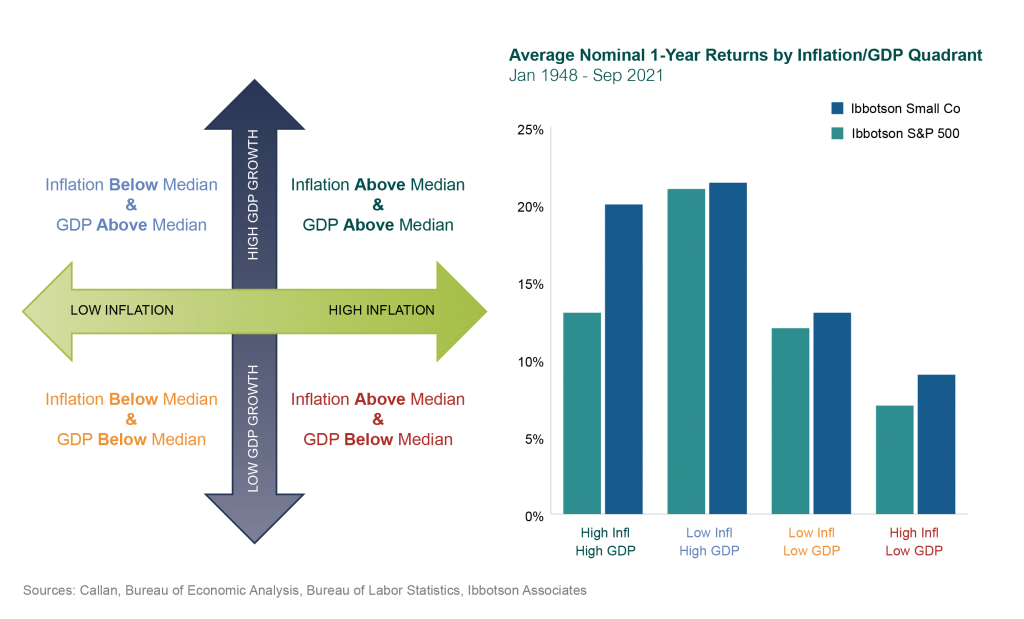
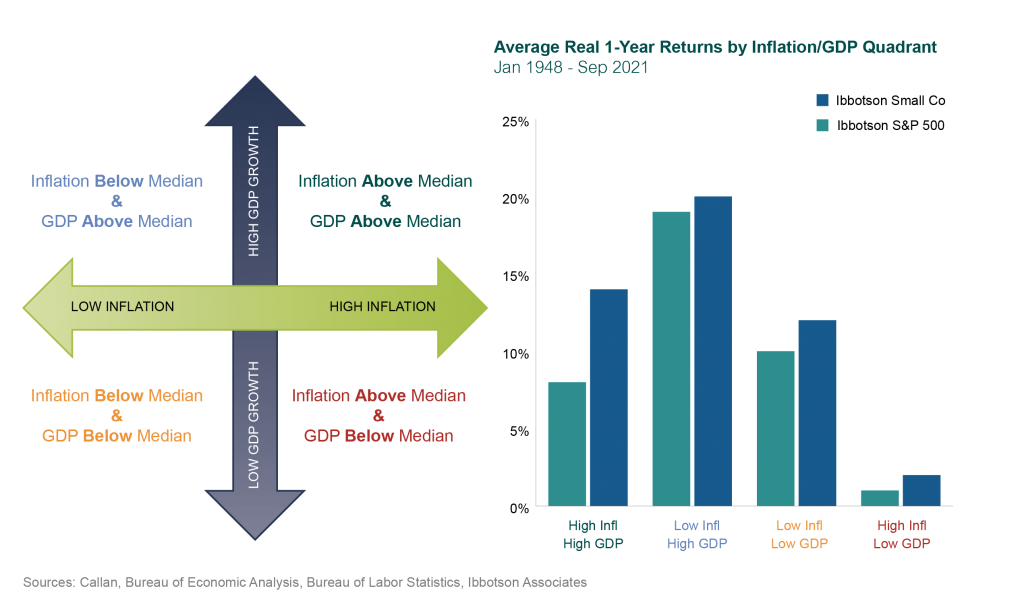
Just as we expected, inflationary periods tend to yield lower equity returns. What about other variables, though, that may have contributed to returns during these identified periods? So, we went one step further to include GDP in the study. We had to change the time period because quarterly GDP data only go back to 1948. Over this time period, median inflation was 2.78% and median GDP growth was 3.04%. The chart below shows that the combination of high inflation and low GDP is the worst environment for equities in nominal terms, while low inflation and high GDP is the best. Interestingly, equities fared better when both inflation and GDP were high than when both were low.
This next chart shows that the combination of high inflation and low GDP is the worst environment for equities in real terms as well. Large cap equities fared better when both inflation and GDP were low, but small cap equities still did better when both inflation and GDP were high.
Long-term performance shows that public U.S. equities do well even after accounting for inflation. Dating back to 1926, the Ibbotson S&P 500 has returned 10.4% annualized on a nominal basis. Inflation has averaged a little over 3%, so the Ibbotson S&P 500 has returned 7.3% annualized in real terms. The Ibbotson Small Company Index has returned 12.0% nominal and 8.9% real over this same time on an annualized basis.
Inflation is only one of the factors driving markets in the discrete periods we examined. Factoring in GDP growth suggests that lower-growth, higher-inflationary environments are the worst for equities. In all other GDP/Inflation environments, real returns have been relatively strong for equities, making them among the best traditional asset classes to own for generating real returns over the long-term.
For Investment Managers & Advisers
You are now leaving Callan LLC’s website and going to Callan Family Office’s website. Callan Family Office is not affiliated with Callan LLC. Callan LLC has licensed the Callan® trademark to Callan Family Office for use in providing investment advisory services to ultra-high net worth clients, family foundations, and endowments. Callan Family Office and Callan LLC are independent, unaffiliated investment advisory firms separately registered with the Securities and Exchange Commission under the Investment Advisers Act of 1940.
Callan LLC is not responsible for the services and content on Callan Family Office’s website. Inclusion of this link does not constitute or imply an endorsement, sponsorship, or recommendation by Callan LLC of their website, or its contents, and Callan LLC is not responsible or liable for your use of it. When visiting their website, you are subject to Callan Family Office’s terms of use and privacy policies.