The Callan DC Index™ tracks roughly 100 defined contribution (DC) plans with about $250 billion in total assets. The Index serves as a proxy for the DC universe and provides plan-related statistics such as asset class prevalence, average allocation figures, and the average number of plan investment options.
With our comprehensive perspective on the DC plan marketplace, we were able to track how sponsors and participants responded to the uncertainty and volatility of the capital markets stemming from the COVID-19 pandemic, and observed a number of noteworthy data points this quarter:
- The Index posted its second-biggest quarterly loss since inception in 2006.
- Capital preservation and fixed income funds dominated flows, signaling a flight to safety and leading to the lowest-ever flows into target date funds.
- Net transfer activity spiked well above its historical average, indicating a relatively high level of engagement among participants.
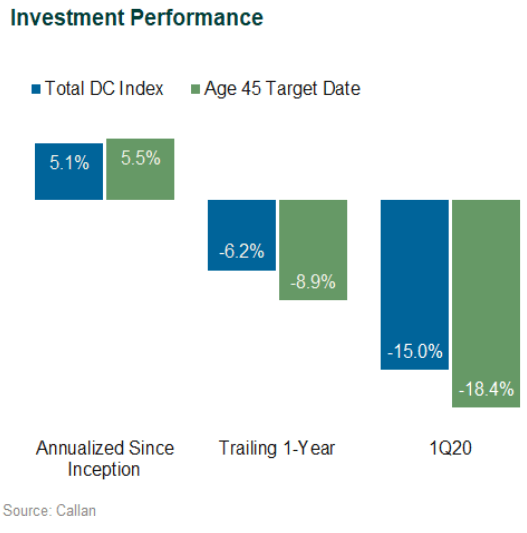
Largest Plunge Since 2008
The DC Index fell 15.0% in the first quarter of 2020, the sharpest plunge since the fourth quarter of 2008, ending four consecutive quarters of gains. The drop brought the Index’s trailing one-year return (-6.2%) into negative territory. The Age 45 Target Date Fund (analogous to the 2040 vintage) posted a larger first-quarter loss (-18.4%) as its higher equity allocation served as a detractor. The Russell 3000 Index lost 20.9% during the quarter, compared to a 3.2% gain for the Bloomberg Barclays US Aggregate Bond Index. However, the Age 45 TDF’s bigger equity allocation has contributed to a higher annualized since-inception return (5.5% vs 5.1%).
The Index’s sharp drop in balances in the first quarter (-14.7%) marked a reversal to four straight quarters of growth and was the highest contraction since the inception of the Index. Poor investment returns (-15.0%) were the sole driver of the contraction; quarterly net flows (0.3%) played a small mitigating role in the drop. This figure will continue to provide a critical measure of how effectively plans retain the balances of retiring workers as it measures the difference between inflows (contributions) and outflows (distributions).
Flight to Safety
With investors seeking less-risky investments, stable value funds saw the largest inflows for the quarter (49.7%). U.S. fixed income (21.2%) and money market funds (13.8%) also experienced sizable inflows. During a quarter marked by relatively high transfer activity, older participants with typically large balances aided by the 10-year bull market were more likely to shift their entire balance into conservative asset classes to avoid volatility and preserve capital, according to research from Morningstar.
Such transfers among this cohort of participants also played a role in the smallest inflows to target date funds (1.9%) since the inception of the Index. This trend coupled with the large flows into capital preservation and fixed income funds seemingly trumped the theory of participant inertia, in which those in a plan tend not to revisit and shift their investment allocations often. The result is even more noteworthy given the large number of plans that use a TDF as a qualified default investment alternative, indicating that participants’ large transfers greatly diminished the effect of regular and often automatic contributions into TDFs.
Brokerage windows (13.0%) also saw a sizable inflow of assets. On the other hand, U.S. large cap equity (-54.3%) and U.S. small/mid cap equity (-26.0%) had the largest percentage of outflows.

First-quarter turnover (i.e., net transfer activity levels within DC plans) in the DC Index increased dramatically to 0.96% from the previous quarter’s measure of 0.38%. This quarter’s turnover figure exceeds the historical average (0.60%) and marked the highest level since the third quarter of 2012. Additionally, first-quarter turnover supports the notion that a sizable cohort of participants shifted a large portion of their balances into relatively safe asset classes such as capital preservation and U.S. fixed income.
The overall allocation to equity within the Index decreased to 66.0% from 70.2% in the previous quarter, the smallest since 2012. This trend was driven by a combination of outflows from equity funds as well as the relative underperformance of equity compared to other asset classes. The current allocation falls below the Index’s historical average (67.9%) by 1.9 percentage points.
For more detailed information about the Callan DC Index, and to track its behavior over time, please see our dedicated web page.