Callan has just published the 2019 Investment Management Fee Study, which provides a detailed analysis on fee levels and trends across multiple asset classes and mandate sizes for both active and passive management. The analysis gives insight into what institutional investors are actually paying (negotiated fees) versus the managers’ published fee schedules.
The study, the eighth examination of fees we have conducted, reflects trends on 2018 fees paid by Callan clients representing over $500 billion in assets under management and $1.8 billion in total fees paid, covering over 350 investment firms and over 165 institutional investors.
Here are some of the key trends from this year’s survey:
- 98% of total fees paid went to active managers, while 70% of assets were managed actively.
- Fees were concentrated; 50% of total fees went to under 10% of management firms.
- Hedge fund-of-funds had the highest fees: 112 basis points.
- Passively managed U.S. large cap/all cap had the lowest: 2 bps.
- Pricing power was strongest for private real estate and non-U.S. equity products.
In this post, I also wanted to describe a number of the new features we added for this year’s study:
Actual vs. Published Fee Analysis: In addition to comparing the published fees for all products in each asset class category to the actual fees paid for client mandates in that category, this year’s study added a comparison to the published fees for only the products in each asset class that have client mandates. This new level of analysis provides insight into the published fees for successful products (i.e., those that received client mandates) and a better understanding of negotiated discounts.
Vintage Analysis: The study examined actual fees by vintage of hiring date to better measure fee trends over the last 20 years.
Industry Concentration Analysis: We examined concentration of assets under management (AUM) and actual fees/revenues by investment firm.
New Asset Classes: This year’s study added:
- U.S. mid cap equity
- Emerging market debt
- Multi-asset class (MACs)
- REITs
New Vehicle: In addition to separate accounts, we added collective investment trusts to the study; mutual funds were excluded from the analysis.
New Fee Data: In addition to basis points fees, we analyzed average mandate sizes and average fees paid in dollars to gain insights into the health of the investment management industry.
Here’s a more detailed look at some of these new features:
Fee Analysis
The fee analysis was done for each asset class and is meant to show current industry fees from three perspectives:
- Standard “published” fees from the broad universe of all competing products (universe published)
- Published fees (pre-negotiation) for only the subset of those products that have Callan client mandates (mandate published)
- Actual fees paid (after negotiation) for those client mandates (mandate actual)
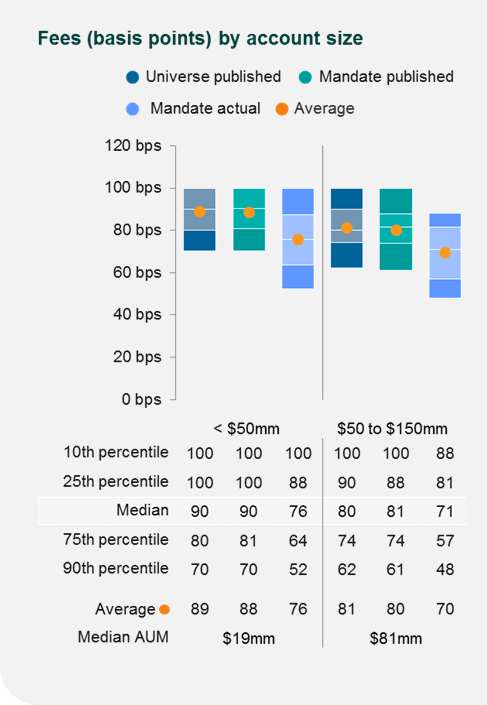
As the chart to the left shows, the goal is to illustrate and compare the fees for the total competitive landscape, the fees for those products successfully winning mandates from Callan clients, and the actual fees those clients ended up paying in 2018.
Vintage Fee Analysis
The vintage fee analysis allowed us to dive deeper into fees for actual client mandates to illustrate the changes in the fee environment over the last 20 years.
In order to better display these changes in investment management economics, the analysis focuses on not just changes in average actual fees in basis points (% of AUM), but also changes in average mandate sizes and the resulting changes in average dollar fees per client mandate.
Examining fees in both basis points and actual dollars per client gives a clearer picture of how sustained downward pressure on both fee schedules and mandate sizes results in significantly lower dollar fees paid (manager revenue) per client. Showing results in dollars is more illuminating in cases where the average fee in basis points appears stable, but the average mandate size declines materially, resulting in a lower average dollar fee.
This analysis groups client mandates into three vintages based on the inception date of the mandate:
- 1999–2008 (10 years pre-GFC)
- 2009–2013 (first 5 years post-GFC)
- 2014–2018 (most recent 5 years)
The vintage groups are further broken down into mandate size ranges. For each vintage and mandate size group we calculate: weighted average fee in basis points, average mandate size in dollars, and average fee per mandate (client) in dollars.
Although we use inception vintage groups to differentiate industry fee dynamics over time, it is important to note that the fees being used are the current fees, not necessarily what they were at inception (original fees not reliably available). Since some clients do periodically renegotiate fees with their managers, it is likely that some of the mandates in the older two vintages (particularly the pre-GFC vintage) had higher fees at inception. This means our analysis probably understates fees in the earlier vintages and therefore also understates the downward change in fees from then to now.
Concentration Analysis
The study also conducted a concentration analysis on the actual client fee dataset both at an industry level (active and passive) as well as asset class by asset class to provide insights into how the competitive pie is being allocated across investment firms by our clients. The results illustrate the number of mandates in each area as well as how many different firms manage those mandates. Concentration of market share in each area with respect to percent of total AUM and percent of total fees is highlighted by showing how many firms control 50% of each. Where relevant we also determine the market share of active vs. passive in an asset class.
The full fee study, which includes the detailed analysis for each asset class broken down by mandate size, is available here.
Contributors to the fee study included Alpay Soyoguz, manager of Callan’s Measurement Development Group; Matt Loster, an analytical expert in the Measurement Development Group; and Shane Blanton, a business analytics specialist in the Published Research Group.