A strong quarter closed out a strong year for markets around the world, powered by synchronized global economic growth, a new tax law in the U.S., and low interest rates and inflation. Emerging markets outpaced developed markets for the fourth straight quarter.
U.S. Stocks: Accelerating Growth Spurs Equities
The U.S. equity market continued its upward trajectory in the fourth quarter, closing out a very strong year marked by continued low volatility despite a turbulent U.S. political landscape and a record year in terms of global catastrophes. Investors embraced accelerating global economic growth as well as low interest rates and inflation. Corporate earnings registered double-digit growth for the quarter, receiving a boost from the U.S. tax overhaul bill, which was signed into law in late December.
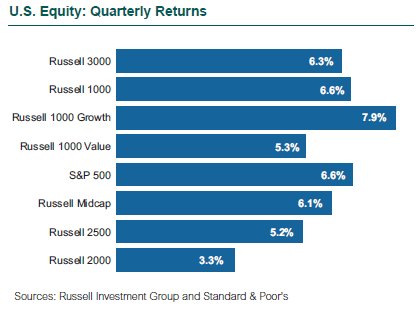
The S&P 500 Index rose 6.6% in the fourth quarter, and its 21.8% gain for the year was its best since 2013. The Index hit 62 record highs during the year and had only eight days of 1% or more fluctuations, the lowest number since 1964. The S&P 500 Price Index has nearly tripled (+295%) since its low in March 2009. Valuations are stretched by most measures, but estimates for future earnings are also strong. Large cap stocks (Russell 1000: +6.6%) outperformed small cap (Russell 2000: +3.3%) across styles for the quarter.
Riskier assets continued to lead the equity market. Consumer Discretionary (+9.9%) and Technology (+9.0%) were the strongest performers, with Apple, Amazon, and Microsoft posting 10%-20% returns due to ongoing exceptional cash flow generation and growth in global markets. The Tech sector now accounts for 24% of the S&P 500 and 38% of the Russell 1000 Growth Index; returns for the FAAMG stocks (Facebook, Apple, Amazon, Microsoft, Google) ranged from 36% to 56% for 2017.
Consumer Discretionary benefited from strong year-end retail sales as well as positive tax reform expectations as the retail industry carries the highest industry effective tax rate at 35%. The “Amazon Effect,” however, continues to threaten the sector as many large retailers have been forced to close stores or lower prices to unsustainable levels.
The Energy sector (+6.0%) continued to improve in the fourth quarter although it closed out the year among the worst performers (-1.0%). A combination of optimism and improvements in the global economy has spurred demand in recent months. More near-term volatility is anticipated in the price of oil as U.S. output is expected to surpass production out of Saudi Arabia for the first time since the early 1990s.
Growth outperformed value during the quarter across the market cap range (Russell 1000 Growth: +7.9% vs. Russell 1000 Value: +5.3%; Russell 2000 Growth: +4.6% vs. Russell 2000 Value: +2.0%). The overweight to Tech and Consumer Discretionary in the growth indices drove the outperformance. Investors favored the stronger earnings and top-line growth outlook in the Tech sector, which also benefited from positive investor sentiment following tax reform.
Momentum-oriented stocks (MSCI Momentum Index: +37.8%) posted their biggest annual gain since 1999, leaving valuations stretched; the MSCI Defensive Index rose 12.3% for 2017. Anecdotally, some momentum-oriented managers are finding their bench of ideas shrinking as they take profits on winners while defensively oriented managers continue to sit on cash waiting for more favorable opportunities.
Global Stocks: Markets in Sync Around the World
Major non-U.S. markets performed largely in line with each other during the quarter, which saw a bit of an inflection point as investors were more willing to capitalize on synchronized global growth and began to rotate out of momentum winners into more cyclical areas such as Financials, Energy, and Materials. Cyclicals led as tax reform, improving commodity prices, and growth projections overcame Brexit fears and election uncertainty in Germany in a risk-on quarter.
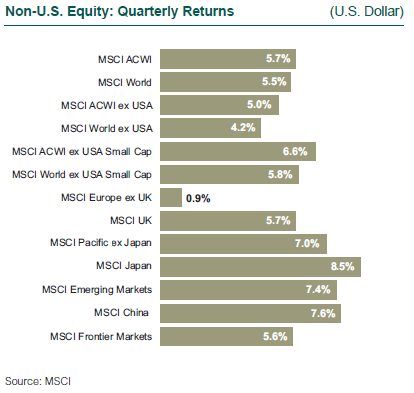
Non-U.S. developed (MSCI EAFE and MSCI World ex USA: +4.2%) trailed U.S. (MSCI USA: +6.4%) after beating it in the previous three quarters. Within MSCI EAFE, the U.K. notched a record high in the fourth quarter and was up 22.3% for the year.
Europe, which led markets in the third quarter on earnings growth and political stability, reverted and trailed other developed regions (MSCI Europe: +2.2%) on Brexit negotiation concerns and political uncertainty following German elections. The European Central Bank also announced plans to curb quantitative easing in January 2018. Japan (MSCI Japan: +8.6%) was the best performer on its election results and improved inflation expectations.
Markets favored economically sensitive sectors: IT (+8.3%), Materials (+7.8%), and Discretionary (+7.6%). Energy was also positive (6.8%) as commodity prices were supported by distribution disruptions and high liquid natural gas usage with winter’s arrival. Defensive sectors lagged as markets continued to rise: Utilities (-0.4%), Health Care (+0.9%), and Telecom (+1.7%).
It was another difficult quarter for value; factor performance favored strong growth (forecasted), earnings and price momentum, high quality, and beta (MSCI World Value: +4.6% vs. MSCI World Growth: +6.4%). Valuation factors were mixed with price-to-book ratios and yield detracting from performance, while earnings-based multiples contributed.
Emerging Markets: Asian Stocks Power Strong Quarter
Emerging market equities outperformed developed in the quarter and for the year (MSCI Emerging Markets (USD): +7.4%; +37.3%). Latin America was the only weak spot in the quarter (-2.3%) but was up a robust 23.7% for the year. Emerging Asia performed the best for the quarter and the year (+8.4%; +42.8%) driven by strong results from China (+7.6%; +54.1%) and Korea (+11.4%; +47.3%).
Local China A shares did even better (MSCI China A 50 Index: +13.7%). October’s 19th National Congress of the Communist Party solidified power around Xi Jinping, reconfirming key policy objectives. Chinese technology continued to perform well but was less of a performance outlier than in previous quarters. China’s increasing and less-visible debt is a growing concern, while expectations for stronger growth are buoying the market.
South Africa (MSCI South Africa: +21.4%) was the best performer as commodity prices firmed and investors cheered a leadership change. Mexico (MSCI Mexico: -8.0%) was the worst-performing emerging market country as the peso sold off on NAFTA negotiation concerns.
Economically sensitive sectors sold off (Discretionary: -23.6%, Financials: -21.2%). Emerging market Health Care (+16.6%) saw very good performance with outsized contribution from China and South Korea as changing demographics continued to drive demand. Value factors struggled in emerging markets while growth, earnings momentum, price momentum, volatility, and beta were positive.
Non-U.S. Small Cap: Health Care Powers EM Gains
Developed non-U.S. small cap (MSCI World ex USA Small Cap: +5.8%) outperformed its large/mid counterpart modestly, led by Asia. Australia (+11.6%) and Japan (+8.7%) led the segment.
Emerging market small cap (MSCI Emerging Market Small Cap: +9.2%) was the best-performing segment of the equity markets in the fourth quarter, led by Health Care (+28%); Real Estate (-0.1%) was the laggard.
62
The number of record highs the S&P 500 Index hit during 2017.