A rough averaging across fundraising and private investment and exit volumes indicates a drop of only 20% for private equity activity in 2020 from 2019’s normal and healthy market. Private equity has consistently been adaptable and resourceful in fraught markets. In 2020, general partners (GPs) acquitted themselves well by rotating through a disciplined portfolio management process. First was triage on existing portfolio companies, then new investments when valuations plunged, and finally a renewal of exits as prices rebounded. Private equity returns bested public equity indices with less than half the volatility.
Fundraising: Adaptability Is the Theme
- Global fundraising declined 34% in 2020 by number of funds raised, but only 12% by dollars committed—a robust year, especially measured against 2019’s near record total.
- 4Q20 was the strongest of the year and was strong compared to many pre-pandemic quarters.
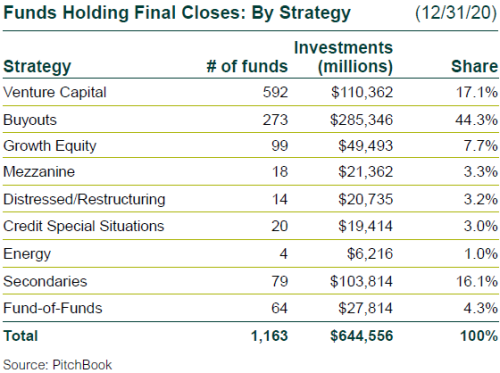
- Buyouts comprised 44% of capital raised in 2020, down from 55% in 2019 and slightly below historical norms.
- Secondaries and co-investments saw a huge jump from a historical mid-single digit range to mid-teens. The rise was due primarily to secondary funds, which saw many of the strategy’s large GPs close funds during the year.

Buyout Investments: Surprisingly Resilient
- The year’s total investment count fell by 20% and announced dollar volume by 36%.
- The good news is that after the 1Q drop, a recovery is in progress. Deal count has already returned to pre-pandemic levels with positive momentum in dollar volume.
- The COVID-19 crisis caused GP investment programs to pivot heavily to less affected industries, particularly technology and certain aspects of consumer products and services, both of which saw a one-third rise in their 2020 percentage share of invested capital.
Large Oscillation in Pricing
- According to S&P, average buyout pricing for the year was 11.4x EBITDA, down slightly from 11.5x in 2019.
- However, the “stadium wave” that produced 2020’s average had much greater volatility. The 4Q average price was 12.0x, a sharp rebound from the 2Q low of 9.2x. GPs were able to restart new investments mid-year at improved price levels, and sellers are returning as prices increase.
VC Investments: Inoculated
- The number of venture capital (VC) investment rounds in 2020 fell by 19%, but the announced dollar volume jumped by 18%. The investment pace was little affected by the pandemic, with deal count holding relatively steady and announced volume marching steadily higher in the quarters after the virus emerged.
- Unicorn financings jumped to 72 in 4Q from 59 in 3Q and totaled 22% of 4Q’s total dollar volume.
- Median pre-money valuations continued to rise throughout 2020, with the largest increase being Series C, up 43% from 2019. The sole exception was Series D, which fell 20% in 1Q, then quickly recovered.
PE-Backed M&A Exits: Recovering Nicely
- Private equity-backed M&A exits were the most affected aspect of the private equity investment cycle in 2020. When prices plunged in March, selling ceased to make sense, and GPs focused first on portfolio stabilization, then on bargain-hunting.
- Private exits fell 31% by count and 42% by announced dollar volume. A recovery appears under way, particularly in deal count, which is a more reliable statistic than announced dollar volume.
PE-Backed IPOs: Good Air Circulation
- The window was wide open for all manner of IPOs in 2020. The year’s private equity-backed IPOs powered upwards 16% by count and 71% by proceeds over 2019.
- The technology and health care sectors proved popular in 4Q, with companies sponsored by syndicates including Carlyle and Cinven garnering the largest proceeds.
Venture-Backed M&A Exits: Mid-Year Dip but Respectable at the End
- Venture-backed M&A exits had a laudable fourth quarter, but the full-year number of exits declined 18% and announced dollar volume dropped 19% compared to 2019.
- All in all, it was a respectable year with a discernable mid-year dip in the number of sales; however, venture dispositions were much less affected than buyout-backed private exits.
Venture-Backed IPOs: Up, Up, and Away
- Venture-backed IPOs increased 46% by number and 65% by capital raised compared to 2019, with the lion’s share occurring in the final two quarters.
- The much anticipated debuts of Airbnb and DoorDash in 4Q accounted for 27% of the quarter’s total proceeds.

Returns: Private Equity Benefits from Public Equity Volatility
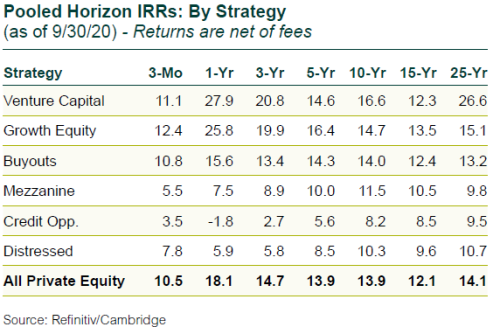
- U.S. public markets rose during both 3Q and the last 12 months. Private equity returns bested public equity in both periods.
- Periodic volatility in the public equity market’s rise—particularly September and March—aided private equity’s outperformance.
- On a public market equivalent (PME) basis, the Refinitiv/Cambridge private equity database outperformed broad public equity indices over all horizons except 5 years and 10 years, where they are neck-and-neck.
- Over those two horizons the asset classes have been trading lead positions for some time now depending on the most recent quarter’s return dynamics. Down periods for public equity advance relative gains for private equity.
